Share MongoDB Query Results: From One-Off Answer to Reusable Report
“Can you send me those numbers again?” It starts with a simple request. You query MongoDB, find the records, and send a spreadsheet. A week later, someone needs the same breakdown. Now you are looking for the original filter, checking the columns, and preparing another export. When a question keeps coming back, the work behind the answer should be reusable. In MongoQUI, you can save query results as a **data source**, then use that source in one or more reports. Your operations team gets an order review. Your manager gets a regional summary. Both start with the same prepared data. Here is how to build that workflow, from the first query to a report you can share.
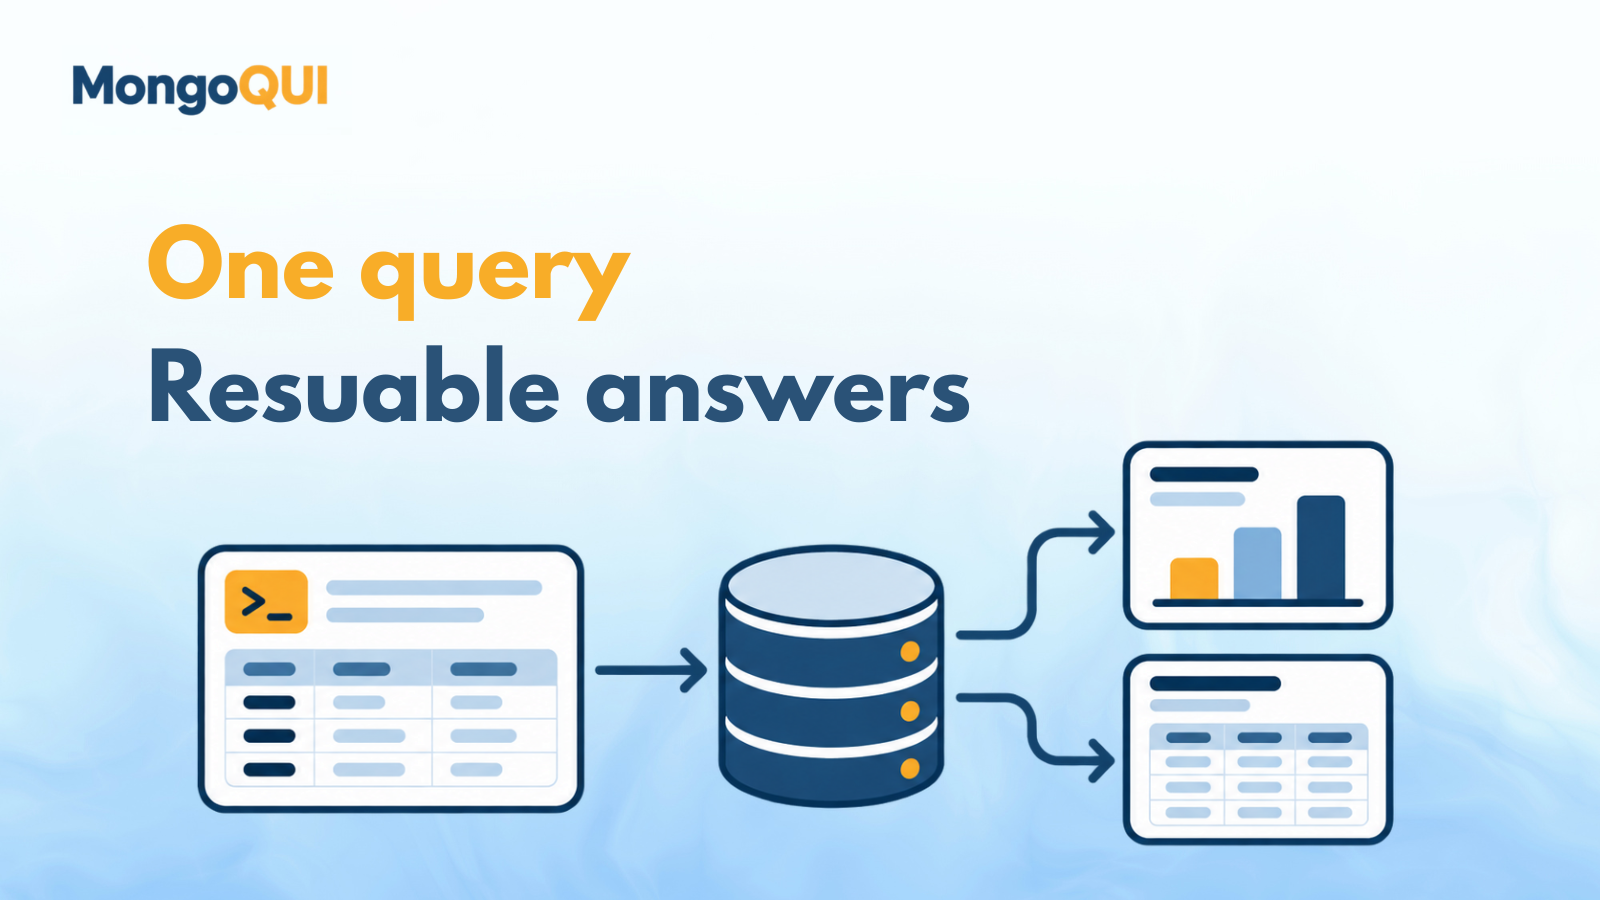
A file for a one-time request. A report for a recurring question.
A CSV or Excel file is useful when someone needs a fixed extract to review, calculate with, or archive. You may not need anything more.
A reusable report becomes useful when the same question returns regularly. Instead of preparing a separate dataset for every report, you define the records and fields once, save a source, and build on it.
Think of a data source as a prepared snapshot of your query results. The report is how you present those results: a table for reviewing individual orders, for example, or a chart for comparing regions.
The snapshot stays as it was when generated until you refresh it. Reuse makes preparation easier; refresh keeps the answer relevant.
1. Ask a clear question and run the query
Suppose your operations team wants to review delivered orders with a total of at least 800.
Open the orders collection in MongoQUI and enter:
{ status: "delivered", total: { $gte: 800 } }
Run the query and inspect a few results. Are the orders marked delivered? Do the totals meet the threshold? Are you looking at the right collection?
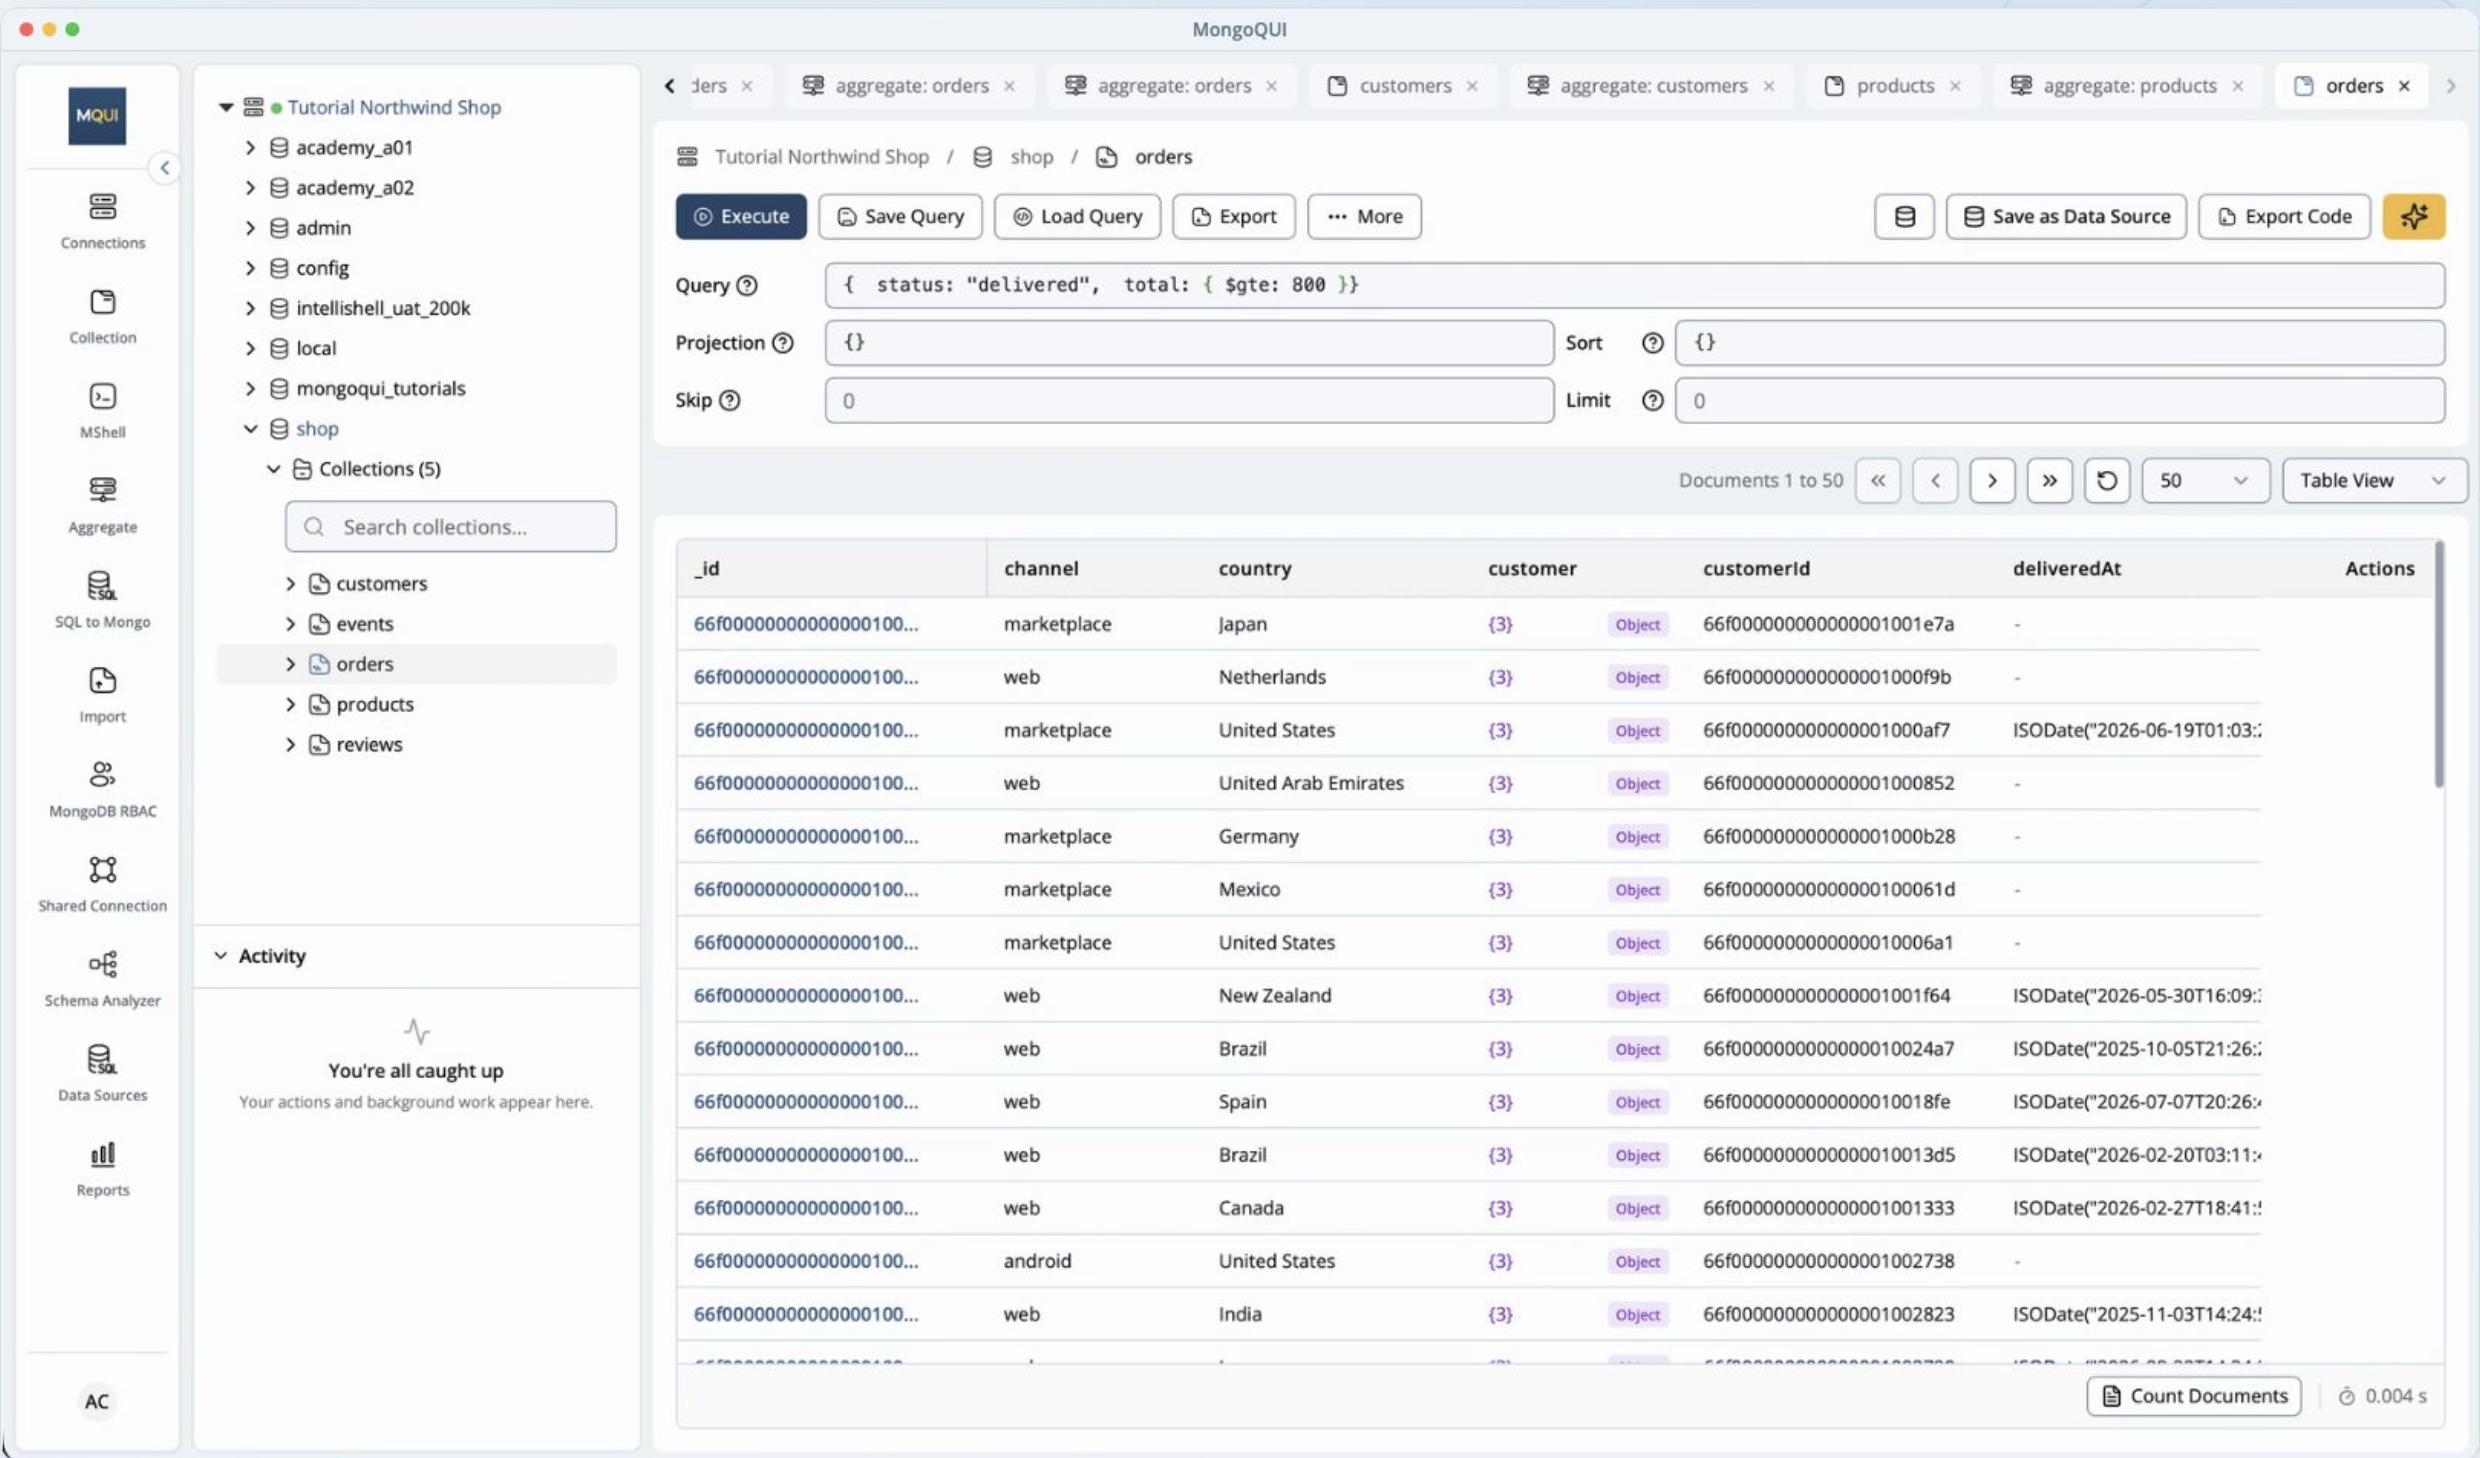
Start with a focused query and check the results before saving the source.
If the request also includes a date range or region, add those conditions before moving on. “Delivered orders” and “delivered orders this month” answer different questions.
2. Save a source your team can recognize
Choose Save as Data Source. MongoQUI opens a wizard with five stages: Setup, Fields, Export, Analyze, and Generate.
Give the source a descriptive name. Delivered Orders — Total ≥ 800 is easier to find and understand than Orders Export 3.
Use the description to explain its purpose. For example:
Delivered orders with a total of at least 800, prepared for the operations review. Includes all regions.
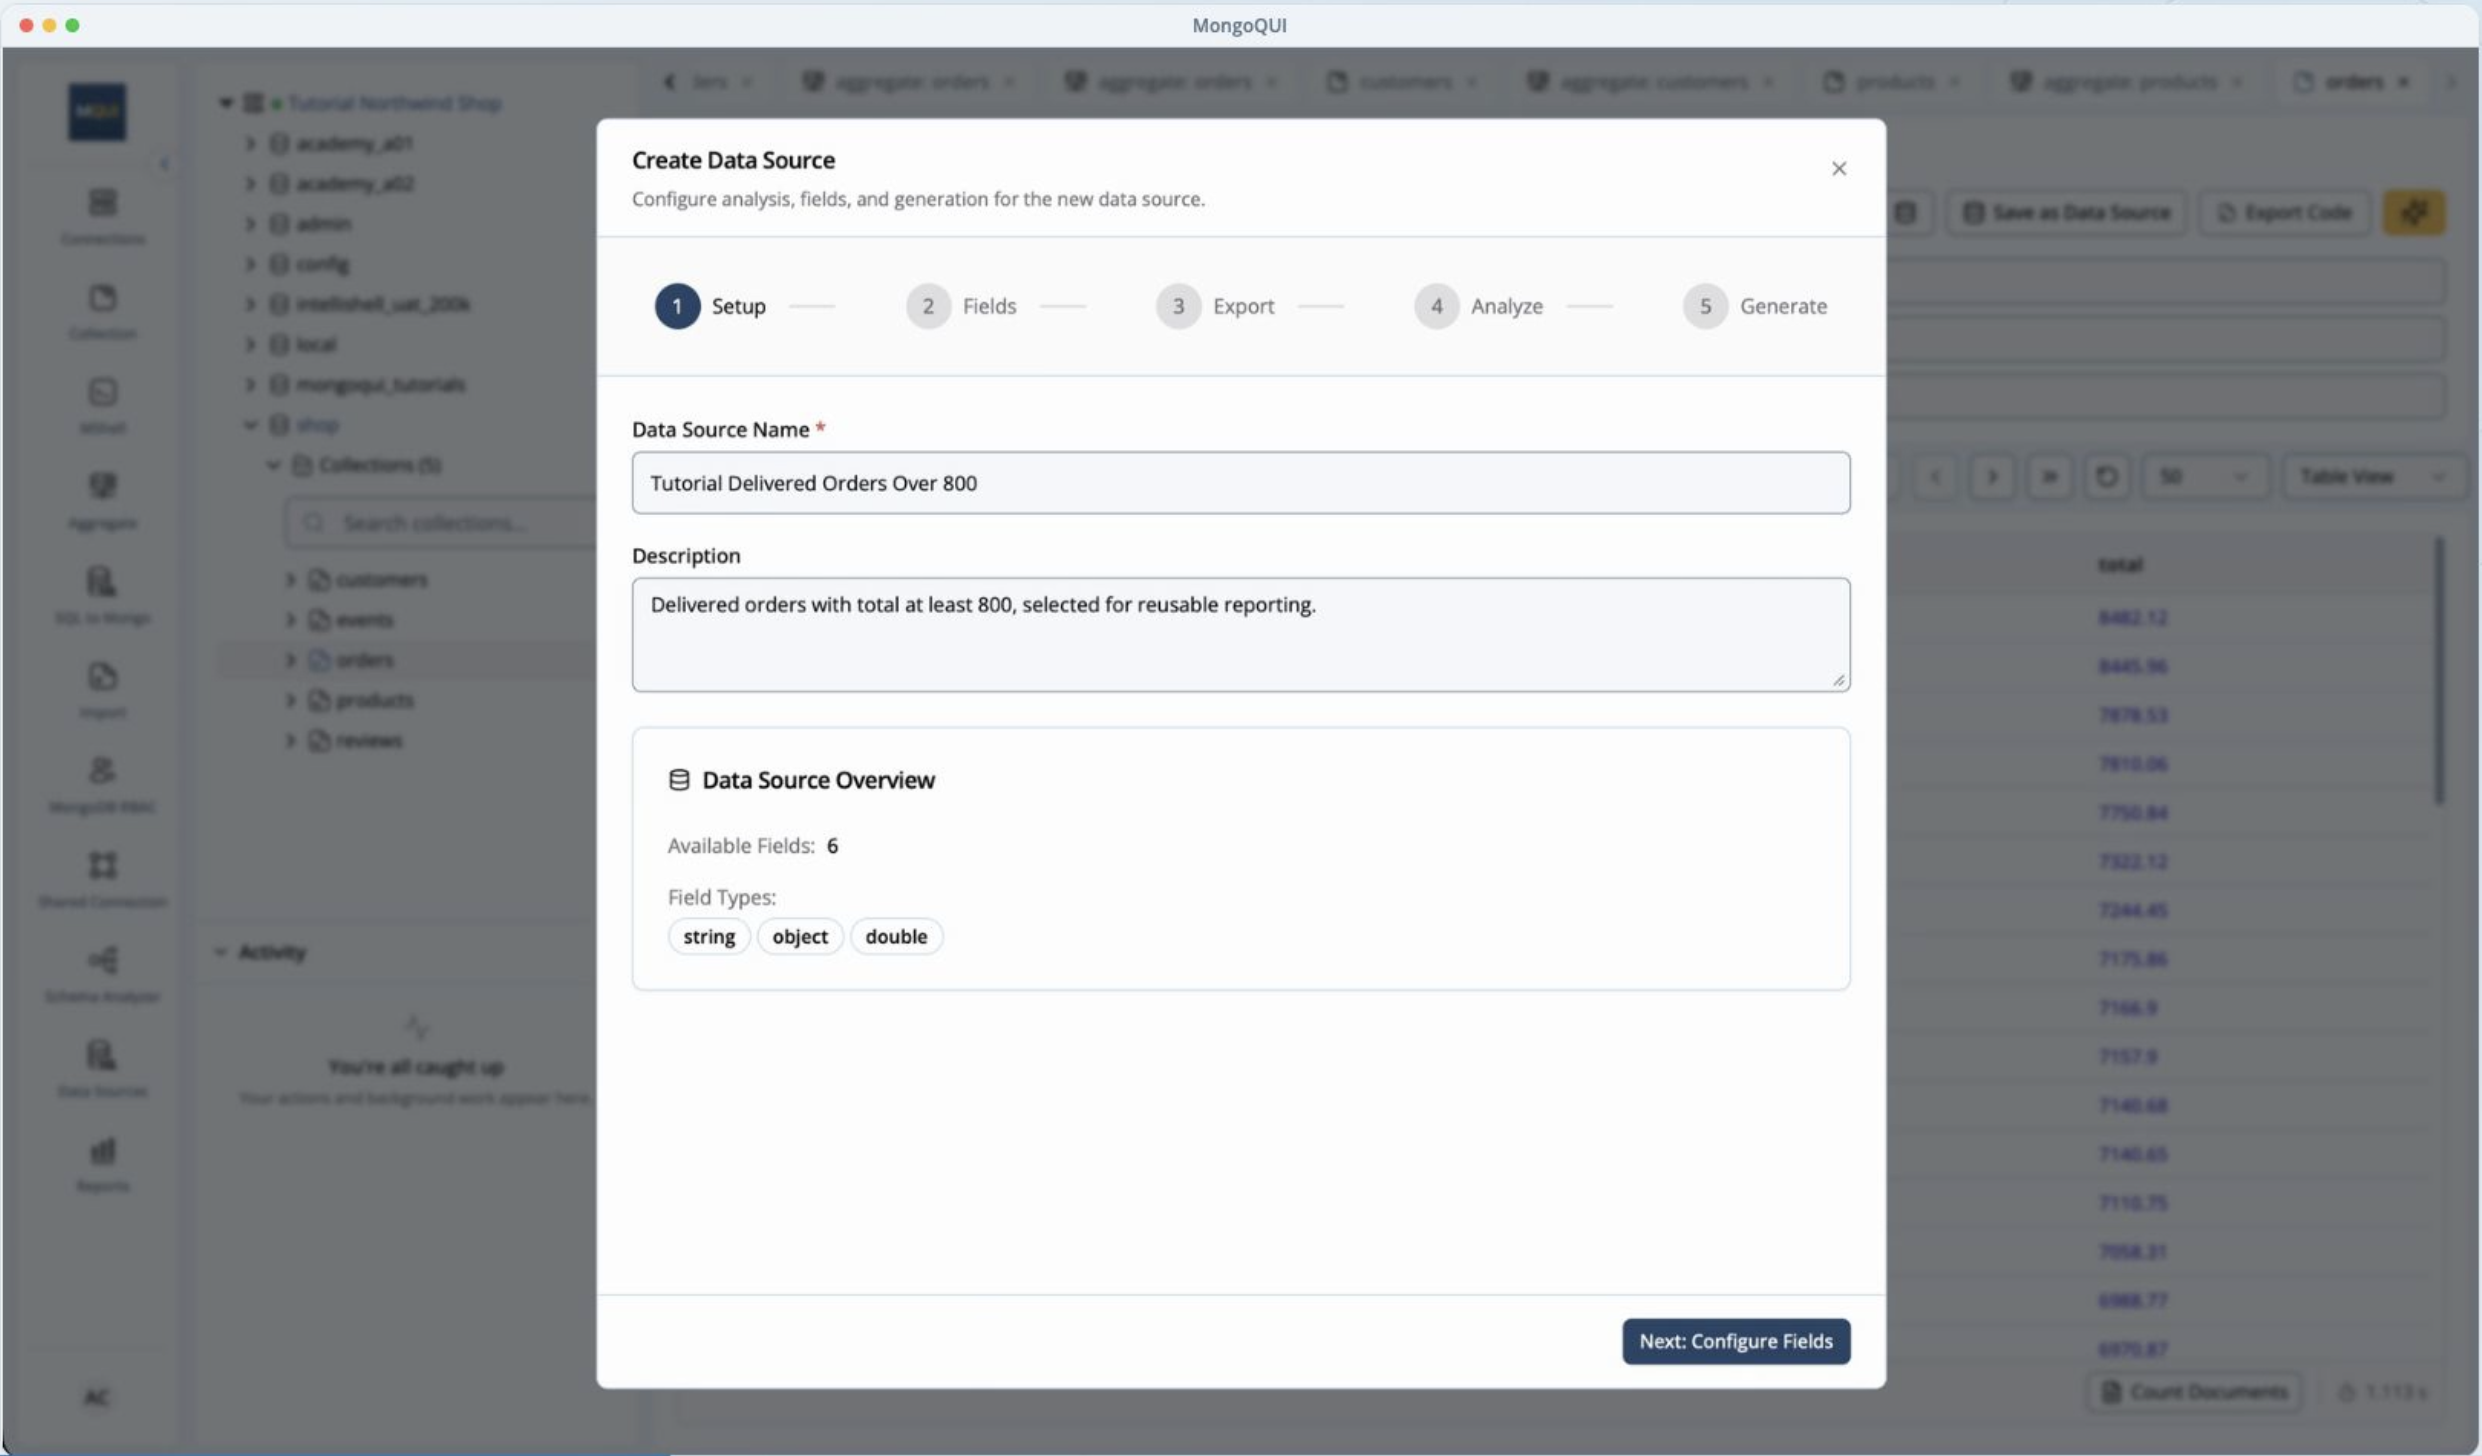
A clear name and description help teammates understand what the source contains.
Be precise about boundaries. “At least 800” includes orders worth exactly 800; “over 800” does not. Small wording choices can save a surprisingly long conversation later.
3. Choose fields that help the reader
In Fields, select the information the report needs. For an order review, that might be:
Field | Why include it? |
|---|---|
Order number | Identify the order for follow-up |
Region | Compare activity across markets |
Status | Keep the delivery condition visible |
Total | Review and summarize order amounts |
Customer names may help an account-management review, but they may be unnecessary for a regional summary. Let the report’s purpose guide the selection.
Review nested fields too. A value such as customer.name can become a column named customer_name, making it easier to work with in the report.
Keep enough context to explain each row, while leaving out unrelated details. A smaller, purposeful dataset is easier to review and maintain.
4. Check the format before generating
In Export, review how the selected fields will be stored in Parquet. Focus on the column names and data types: amounts should be numeric, and labels should be recognisable.
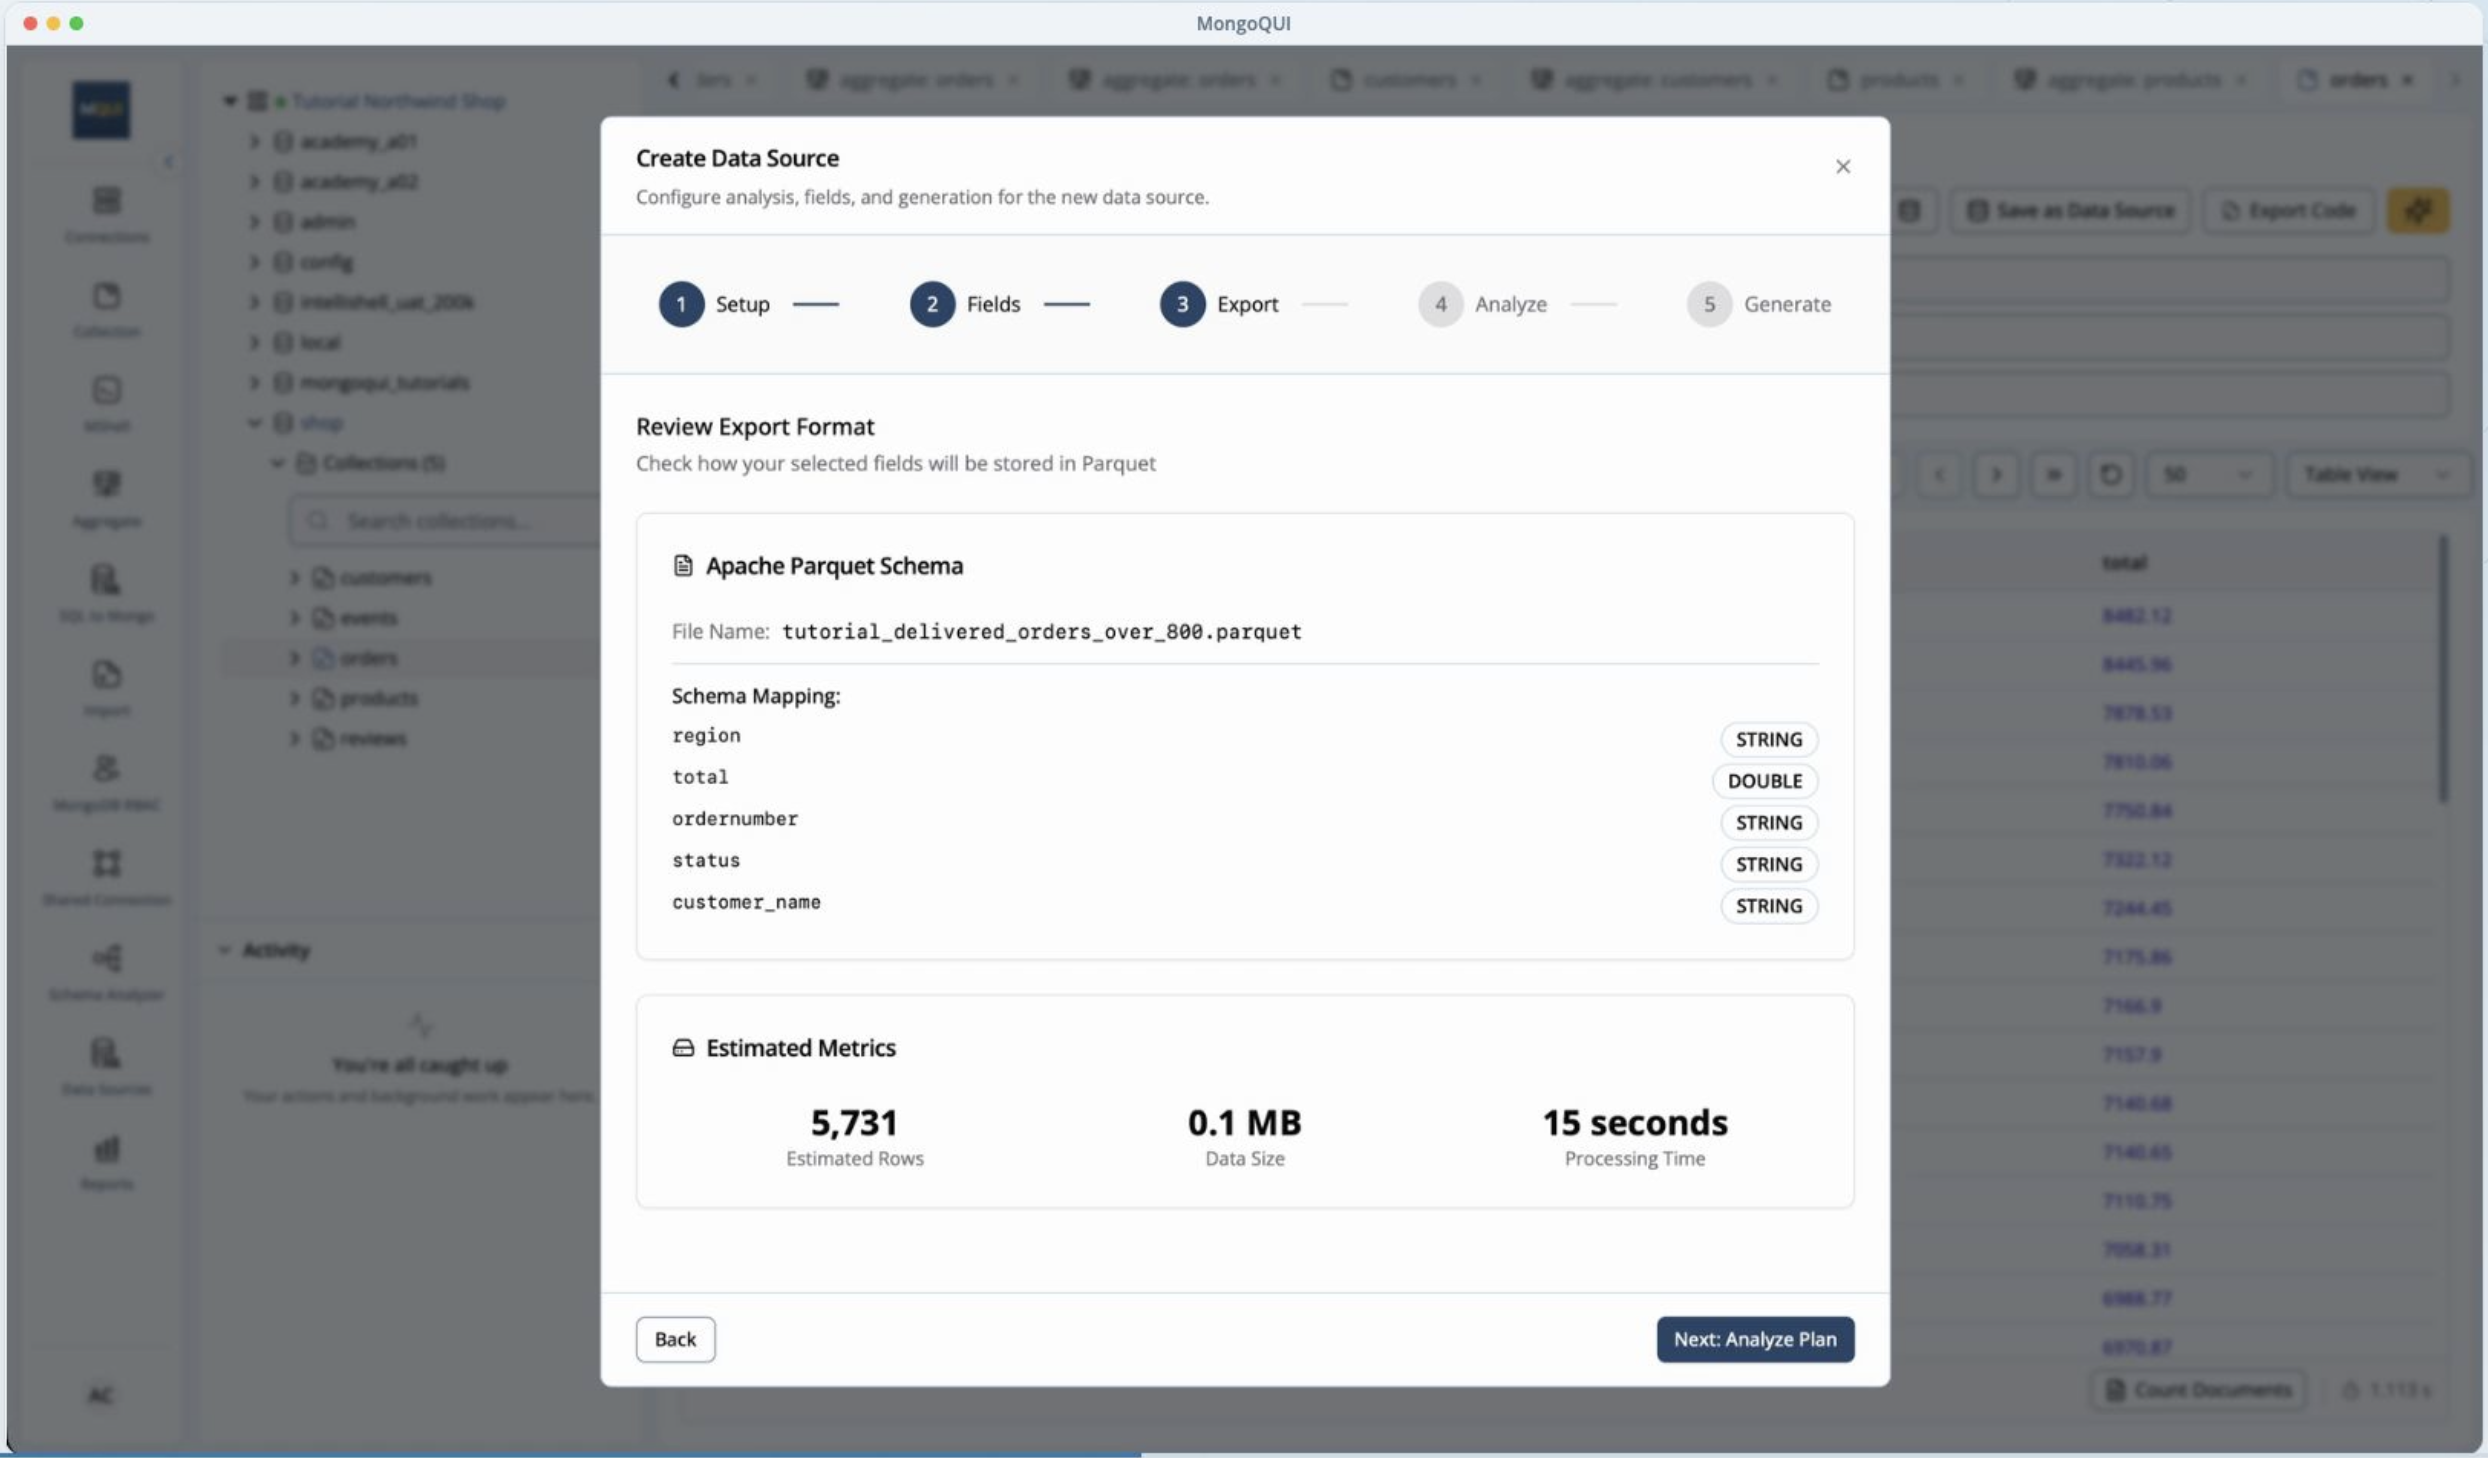
Review the schema so the report receives the columns and types you expect.
For example, a numeric total field lets you calculate sums and averages. If it is treated as text, those calculations may not behave as intended.
The wizard also shows estimated rows, size, and processing time. Review those estimates, continue through Analyse, and check the generation plan before starting the task.
5. Generate the snapshot and attach it to a report
Start generation and follow progress in Activity. Wait until the source is ready before using it in a report.
Once generation completes, you can create a report with the source attached or keep the source for later.
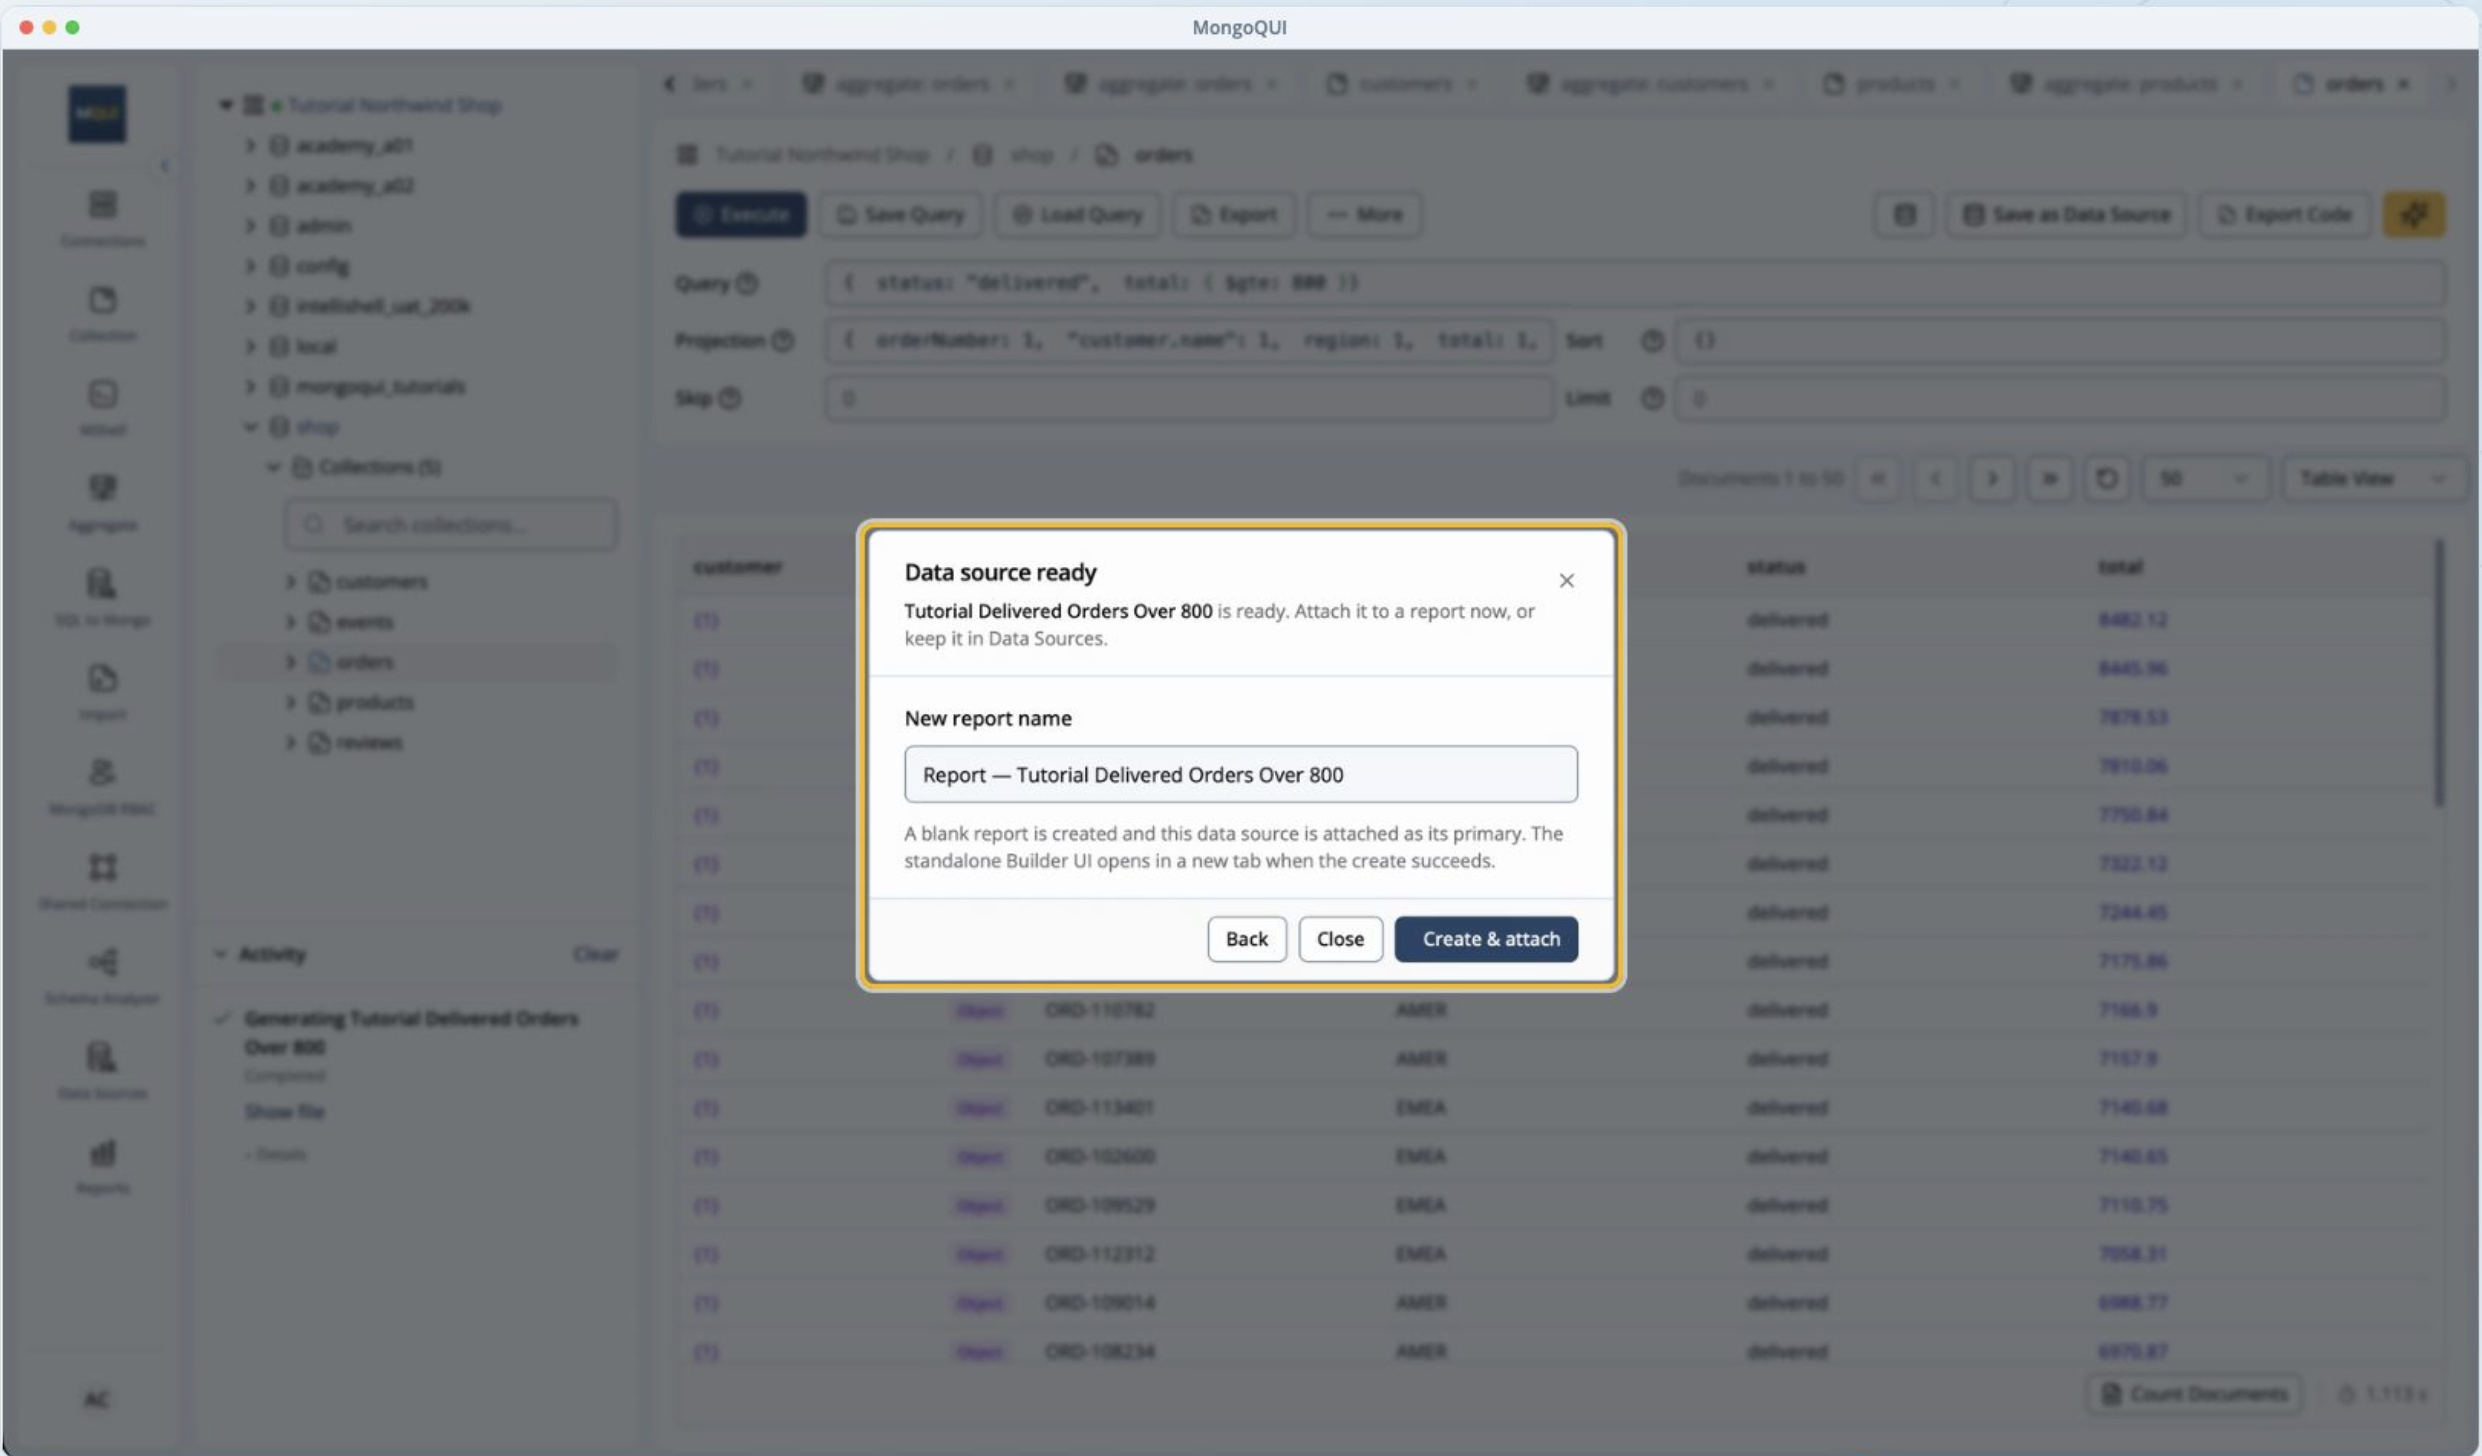
Choose Create & attach to begin a report with the prepared source.
Select Create & attach to move into report building. If you want to return later, find the saved source under Data Sources and check that its status is Ready.
You can reuse the source across reports. An order-level table and a regional summary can reference the same snapshot, keeping their starting data consistent.
Make the report useful to someone outside the database
The person reading your report should be able to understand the answer without interpreting a MongoDB query.
For the operations example, start with a table of the selected orders. Add a regional breakdown if the reader needs to compare markets. Give each view a clear title that describes what it shows.
Before sharing, include three pieces of context:
Scope: Delivered orders with a total of at least 800.
Period: The date range covered, or a clear statement that no date filter was applied.
Freshness: When the snapshot was last generated.
MongoQUI’s Share Report dialog lets you share with organisation members, invite external recipients by email, or generate a read-only public link. Sharing a report gives access to its attached snapshots without granting access to the underlying MongoDB connection or saved query definitions.
Review the attached data before sending the report. The fields available in a source matter as much as the information displayed in a chart. See the report sharing guide for the available sharing options.
Keep the next review consistent
For recurring reports, decide who refreshes the source and when. A weekly operations review might use a snapshot regenerated before the meeting, with the last update clearly labeled.
Refreshing a source lets attached reports pick up the updated data. Creating or regenerating a database-backed source currently requires MongoQUI’s desktop app; ready sources can be managed and used in the web app. The data source guide explains the refresh workflow.
Keep the reporting definition consistent too. If you change the threshold, date range, or included regions, update the name or description so readers understand the change.
Start with one question your team asks often. Save a well-defined source, build a readable report, and share it with the people who need the answer. The next time the request arrives, you have a source to refresh and a report to use again.
Watch the full walkthrough alongside these steps to follow the query-to-data-source process in MongoQUI.
Related posts.

How to Build a Better MongoDB Report With AI Suggestions in MongoQUI
Your product team asks a simple question: which categories have the highest average rating? The data is available, but turning it into a useful report takes several decisions. You need to choose the right dataset, define the average, build the query, and present the result clearly enough for someone else to use. MongoQUI’s AI Suggestions can help you get started. They give you proposed report blocks and queries to review, so you can spend more time checking the answer and improving the report.
Introducing MongoQUI: From MongoDB Data to Answers Your Team Can Use
From exploring MongoDB documents to sharing an answer your team can use. “Which orders still need attention?” The answer is in MongoDB. Getting it into your team’s hands is where the work begins. Someone needs to inspect the records, write the query, check what the numbers mean, and turn the results into something another person can act on. A straightforward question becomes a chain of exports, spreadsheets, and follow-up messages. When someone asks for updated numbers, that chain starts again. We built MongoQUI to make that journey easier: from understanding your MongoDB data to sharing an answer your team can use again. MongoQUI is a MongoDB GUI and workspace that brings database exploration, visual query building, aggregation pipelines, and reporting together. You can investigate a question, build the logic behind the answer, and turn the results into a report within the same workspace. It is built for developers who work with MongoDB, analysts who need to understand its document
MongoQUI Review: The Smarter MongoDB GUI Built for Modern Developers
If you've ever found yourself wrestling with raw shell commands just to inspect a collection or debug an aggregation pipeline, you already know the pain that MongoQUI was built to solve. In a market crowded with aging desktop clients and overly complex IDEs, MongoQUI arrives as a breath of fresh air — a powerful, intuitive MongoDB GUI designed specifically for developers and data analysts who want speed without sacrificing capability.
Get shipping updates once a month.
A monthly digest of what shipped, what’s coming, and one long-form post we loved. Unsubscribe in one click.
By subscribing you agree to receive monthly updates from MongoQUI. See our Privacy Policy.