Introducing MongoQUI: From MongoDB Data to Answers Your Team Can Use
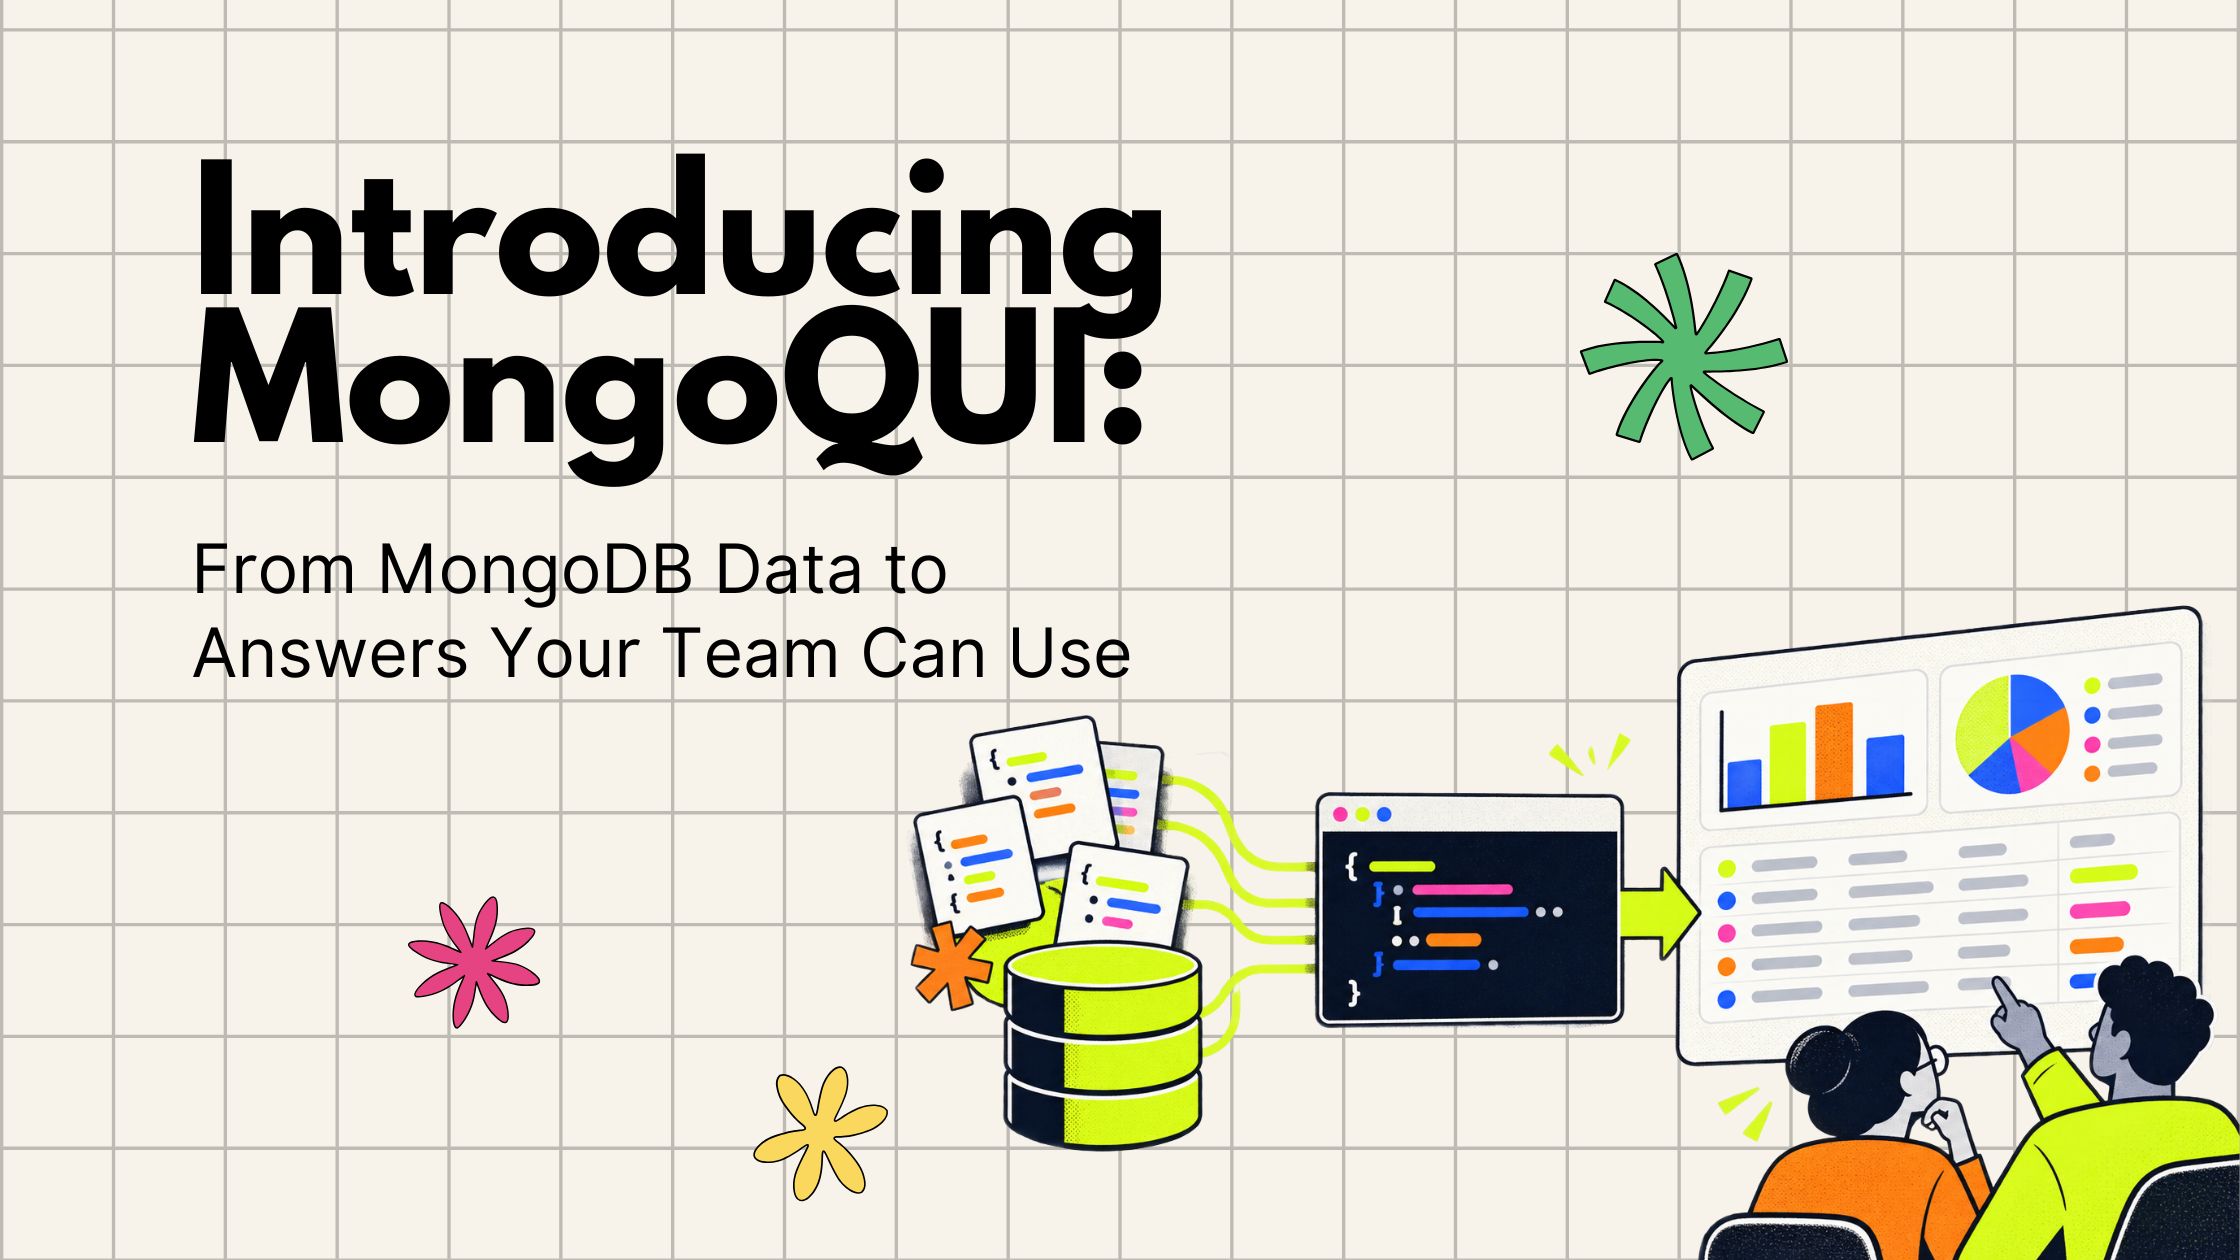
From exploring MongoDB documents to sharing an answer your team can use. “Which orders still need attention?” The answer is in MongoDB. Getting it into your team’s hands is where the work begins. Someone needs to inspect the records, write the query, check what the numbers mean, and turn the results into something another person can act on. A straightforward question becomes a chain of exports, spreadsheets, and follow-up messages. When someone asks for updated numbers, that chain starts again. We built MongoQUI to make that journey easier: from understanding your MongoDB data to sharing an answer your team can use again. MongoQUI is a MongoDB GUI and workspace that brings database exploration, visual query building, aggregation pipelines, and reporting together. You can investigate a question, build the logic behind the answer, and turn the results into a report within the same workspace. It is built for developers who work with MongoDB, analysts who need to understand its document
The concern: answering a question takes too many handoffs

Consider a developer at a growing online store. The operations team wants a list of unpaid orders so they can decide which customers to contact.
The developer finds the records. Then come the questions: Can you group them by region? Include the order value? Remove cancelled orders? Send a version we can review in our meeting?
Each request is reasonable. Together, they turn database work into a recurring reporting task. The query lives in one tool, the chart in another, and the explanation in a message that becomes harder to find over time.
For a small team, that can mean the same developer becomes the person everyone waits on. For an analyst, it means repeatedly preparing data before the actual analysis can begin. For an operations lead, it means waiting for a usable answer even when the data already exists.
That is the problem behind MongoQUI. We wanted the work of exploring data, answering questions, and sharing results to stay connected. A useful investigation should give the team a starting point for the next question, too.
The issue: a query result is only part of the job

Before a team can act on a number, someone has to establish what it represents.
MongoDB documents can contain nested objects, arrays, optional fields, and different data types. Two records in the same collection may need different handling. A field that looks like an amount might not be stored consistently across every document.
Even our unpaid-orders question needs a definition. Does “unpaid” include a payment that failed? Should cancelled orders count? Are we using the order date or the payment due date? If orders use different currencies, should their values appear in separate totals?
Those choices determine whether the answer is useful. A polished chart cannot resolve an unclear definition.
This is why MongoQUI brings data exploration into the same workflow as querying and reporting. You can inspect the documents, decide which records belong in the result, and carry that work into a readable report. The people receiving it can focus on the decision they need to make.
The solution: what MongoQUI actually does
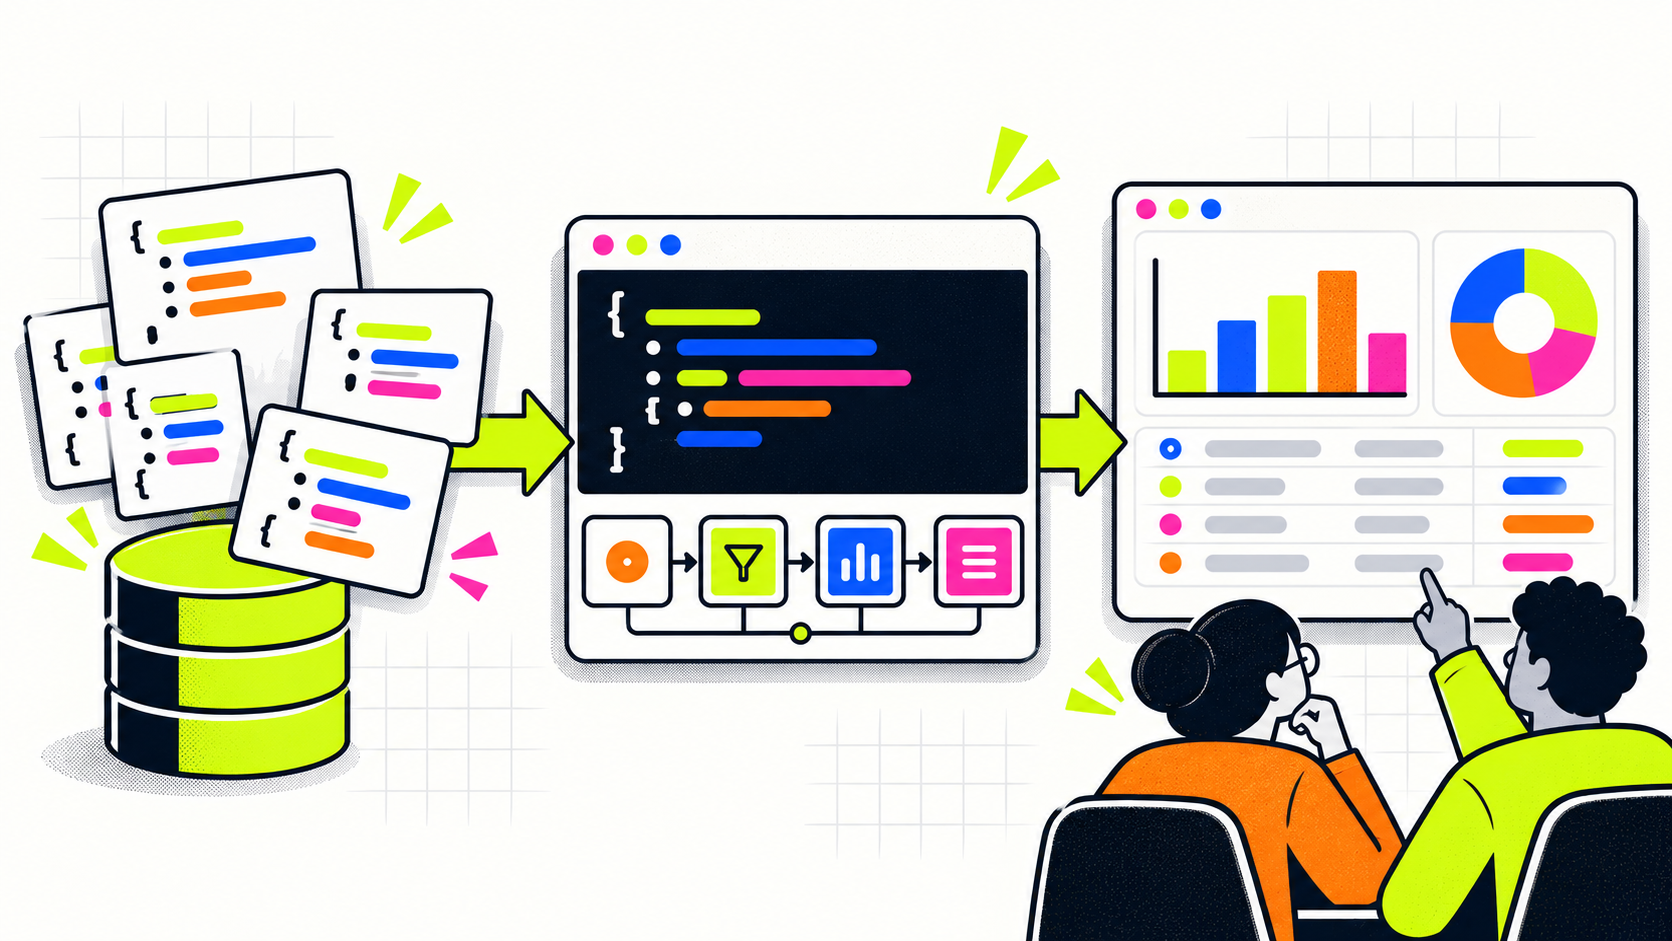
Let’s follow the unpaid-orders question through MongoQUI, from the first look at the collection to the report a teammate opens.
First, understand the data.
Connect to MongoDB, choose a collection, and inspect documents in table, JSON, or tree views. Use the table to scan records and the tree or JSON view to examine nested details. Schema analysis helps you review field names and types across sampled documents before choosing your query conditions.
For our example, you would check where payment status, cancellation status, region, currency, and order value are stored. That gives you a basis for defining the result before calculating any totals.
Next, build the query.
MongoQUI’s visual query builder lets you compose filters, while the raw query editor supports writing the query directly. Use the MongoDB aggregation pipeline builder when the question needs several steps, such as filtering unpaid orders, grouping them by region and currency, and calculating totals.
AI assistance can help turn a plain-language request into a query. You still review the generated logic and check the results against the documents. The aim is to help you get to a query you understand and can reuse.
For a developer, this keeps the investigation close to the data. For an analyst learning a collection, it offers a visual way to work through the question while retaining access to the underlying query.
Then, make the result useful.
MongoQUI’s Report Builder turns datasets into tables and charts. For the operations team, you could create a regional summary and a detailed table of orders that need follow-up. One helps the team see where to focus; the other helps them decide what to do next.
Share the report through a browser link so viewers can open it without installing MongoQUI. Sharing controls include password protection, expiry, watermarks, and access revocation. When you need updated results, re-run the report on fresh data.
The handoff now has a clear destination: a report the recipient can read, with a workflow the author can return to.
MongoQUI also supports the everyday work around that investigation: document editing, imports and exports, index management, saved queries, and query history. Shared connections and role-based access support team workflows. Local database work runs through the desktop app, with cloud features supporting collaboration and reporting.
If you are evaluating MongoDB database tools, start with the work your team needs to complete. MongoQUI is designed for teams that want database exploration, query development, and reporting in one workspace. You can explore its features and compare plans to see which capabilities fit your workflow.
The fix: keep the answer reproducible

The real test comes when someone asks the same question next week.
For our orders example, save the validated query with a name such as “Unpaid active orders by region and currency.” Add a short explanation to the report: which payment statuses are included, how cancellations are handled, which date range applies, and when the data was refreshed.
A teammate can then understand what they are looking at. The author can return to the saved logic, review whether the definition still fits, and run it again. If the business question changes, there is an existing investigation to build on.
This is where MongoQUI’s value becomes most concrete:
Developers can turn recurring data requests into saved queries and reports they can revisit.
Analysts can move from inspecting unfamiliar documents to building a result and explaining it visually.
Product and operations teams can read shared reports without installing a database tool or writing the underlying query.
We built MongoQUI for this connection between the people who understand the database and the people who need to use its answers. The goal is to make useful database work easier to continue, explain, and share.
A five-minute practice task
Start with one question your team already asks. Keep it small: orders awaiting payment, support requests awaiting a response, or records with a missing field.
With MongoQUI connected to a small sample collection:
Inspect a few documents and identify the fields that define your question.
Filter for one relevant status or condition, then check a few matching records.
Select the fields a teammate would need to understand the result.
Save the query with a name that explains what it answers.
You now have a repeatable starting point. As a next step, turn the result into a table or chart in Report Builder, explain what is included, and share it with the person who needs the answer.
Download MongoQUI and bring one real question from your team. For the reporting and collaboration capabilities you need, compare the available plans.
Related posts.
MongoQUI Review: The Smarter MongoDB GUI Built for Modern Developers
If you've ever found yourself wrestling with raw shell commands just to inspect a collection or debug an aggregation pipeline, you already know the pain that MongoQUI was built to solve. In a market crowded with aging desktop clients and overly complex IDEs, MongoQUI arrives as a breath of fresh air — a powerful, intuitive MongoDB GUI designed specifically for developers and data analysts who want speed without sacrificing capability.
Get shipping updates once a month.
A monthly digest of what shipped, what’s coming, and one long-form post we loved. Unsubscribe in one click.
By subscribing you agree to receive monthly updates from MongoQUI. See our Privacy Policy.