How to Build an AI-Assisted Report in MongoQUI
You have a product catalog full of ratings, categories, and other useful details. Now you need to answer a simple question: which categories do customers rate most highly? Turning that question into a clear report takes a few decisions. You need to choose the right data, work out the calculation, and present the results in a way people can understand. MongoQUI’s AI Suggestions help you get started. You can ask a focused question, explore suggested charts, and refine a query before adding it to your report. This MongoDB tutorial walks through that process using average product ratings as an example.
Start with a clear question
A useful report starts with something specific you want to learn.
For a product catalogue, you might ask:
Which product categories have the highest average rating? Include product counts for context.
This question gives the analysis a clear purpose. It identifies what to compare (product categories) and what to measure (average ratings).
Asking for product counts adds context. A category with three highly rated products tells a different story from one with dozens. Seeing both measures helps readers interpret the averages more thoughtfully.
Before generating suggestions, check your selected data source. In this example, we’re working with a saved catalogue containing 128 products. Confirm that you’ve chosen the catalogue you intend to analyse and that it includes the category and rating fields you need.
Use AI Suggestions to explore your options
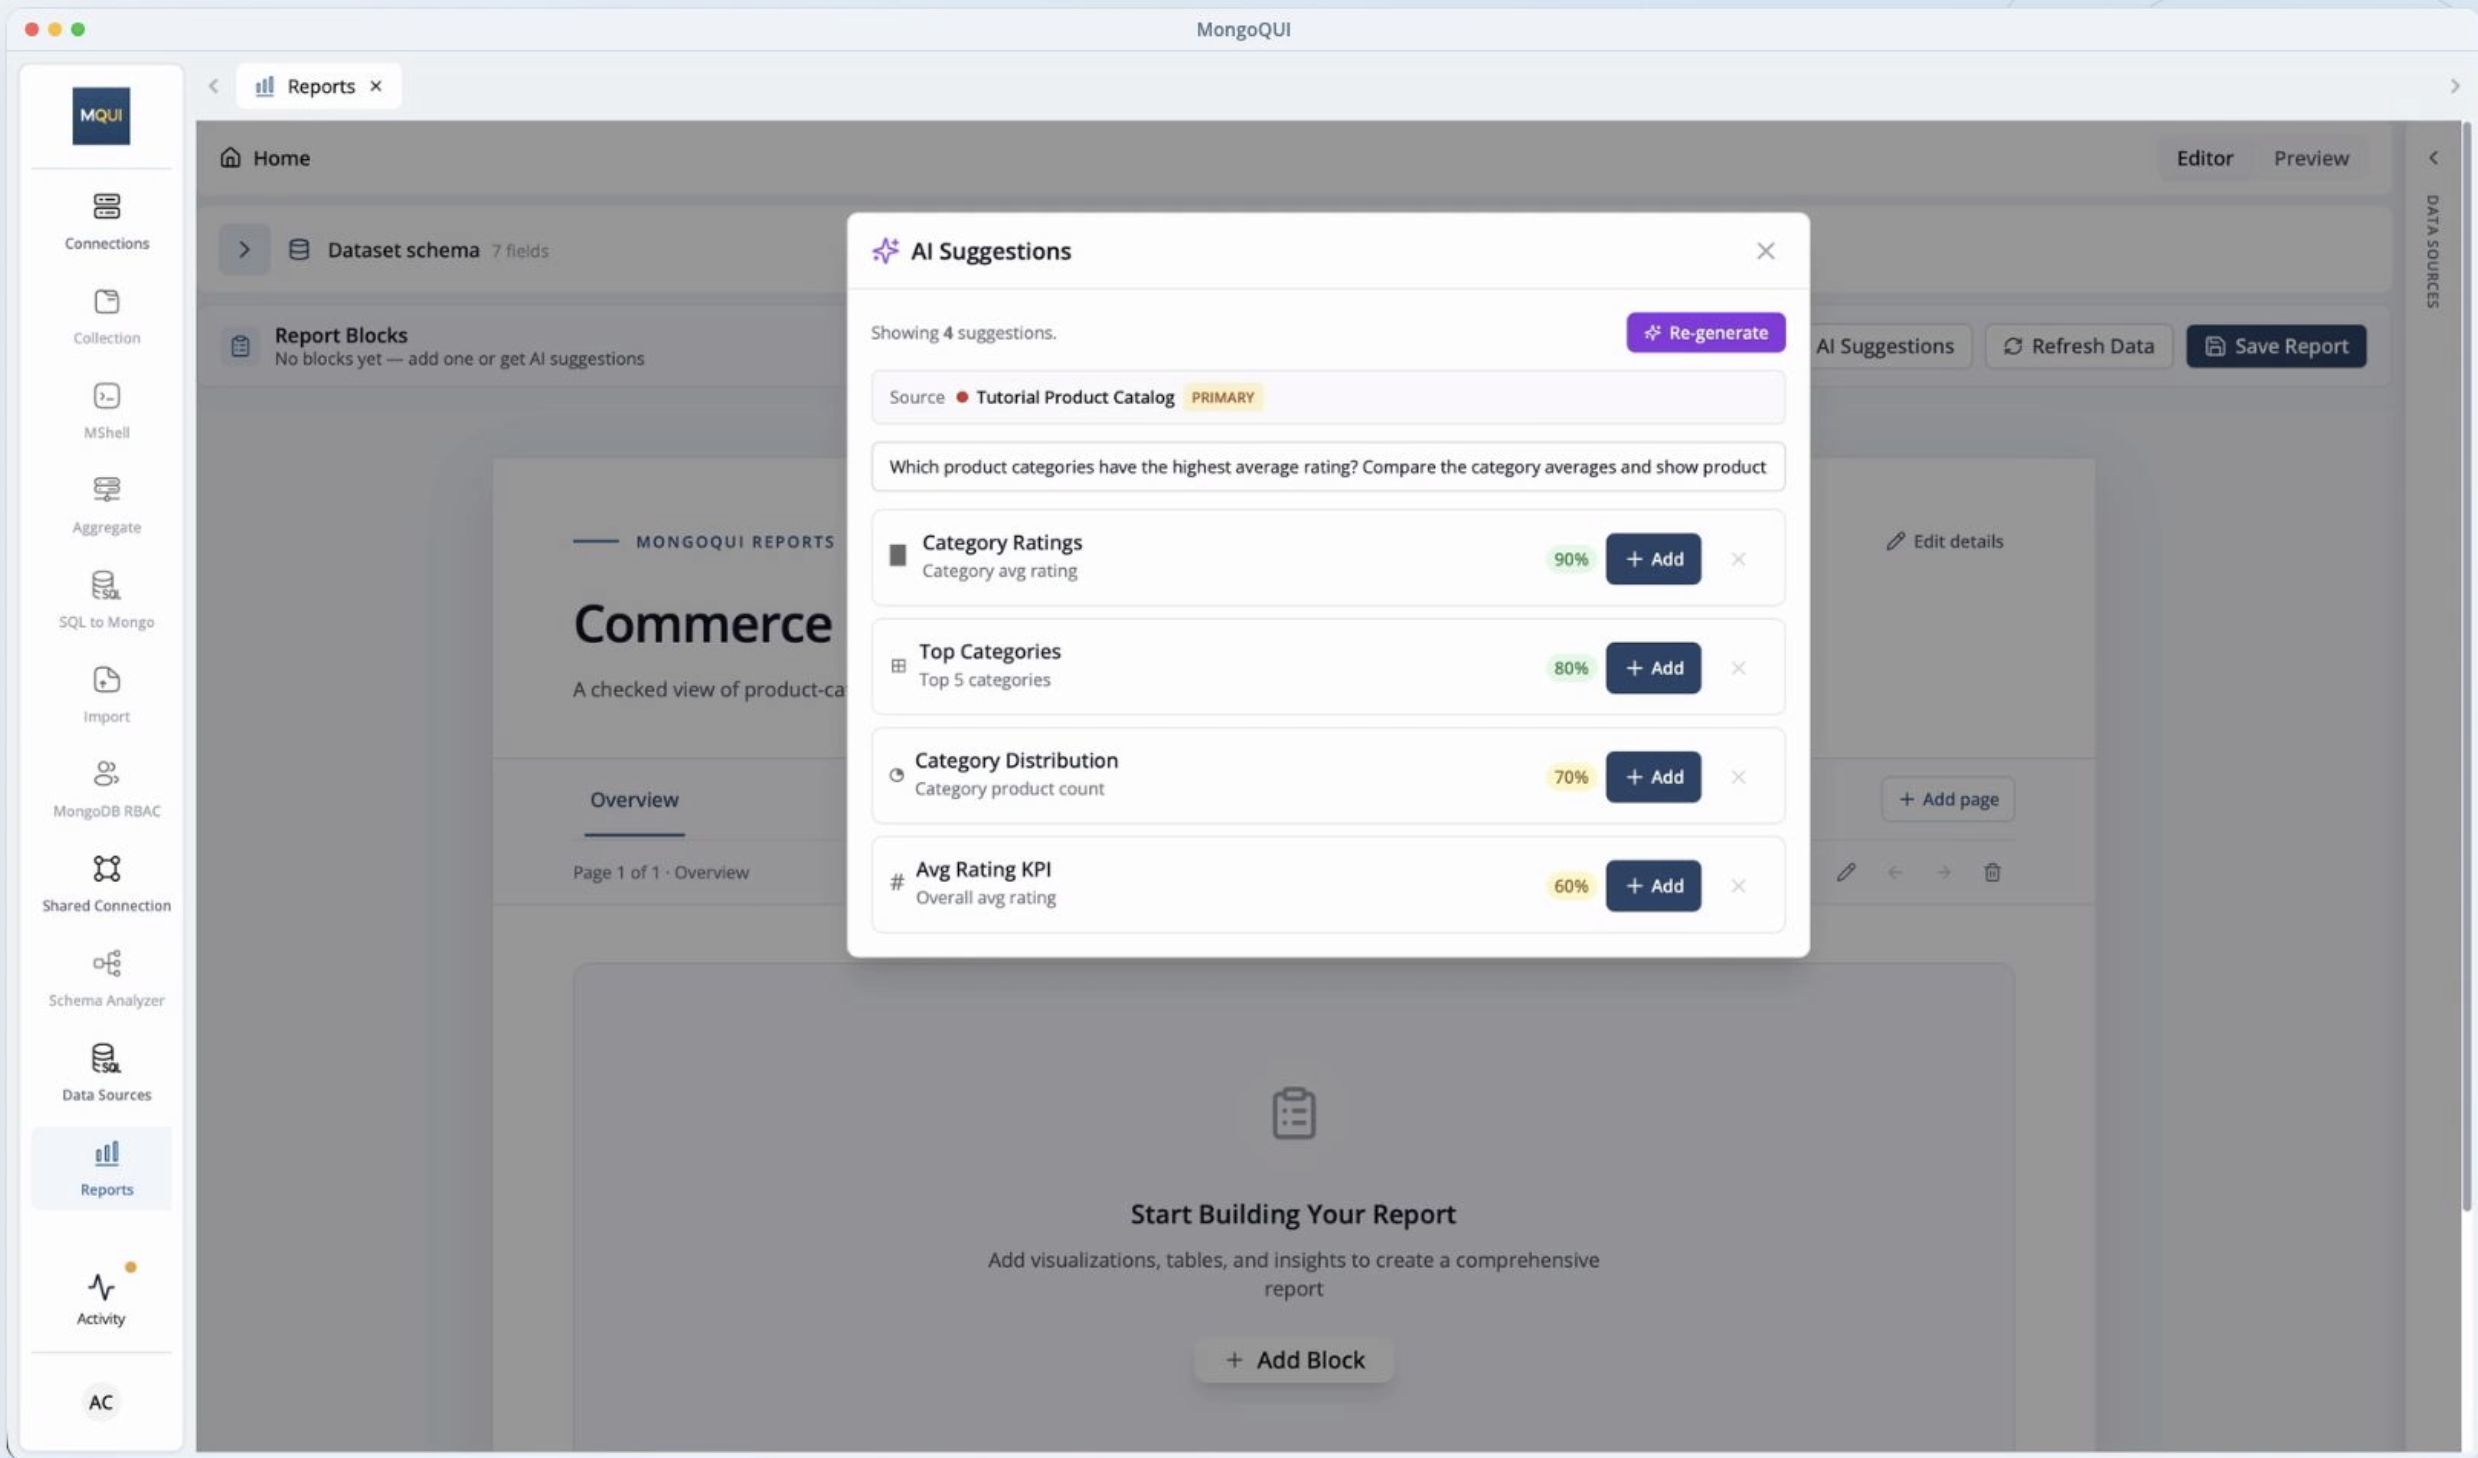
Open AI Suggestions and enter your question. You can also use the optional hint to give the AI more direction.
MongoQUI may suggest several ways to present the data, including charts comparing category ratings and metrics showing product counts. Review the options with your original question in mind.
A chart showing average ratings by category is a useful starting point because it makes the comparison easy to see. Choose that suggestion, then check whether it also includes the product counts you requested. You may need to refine the block or add a separate count view to answer the full question.
A confidence badge can help you assess a suggestion, but the query and its results still need your review.
Understand what the query calculates
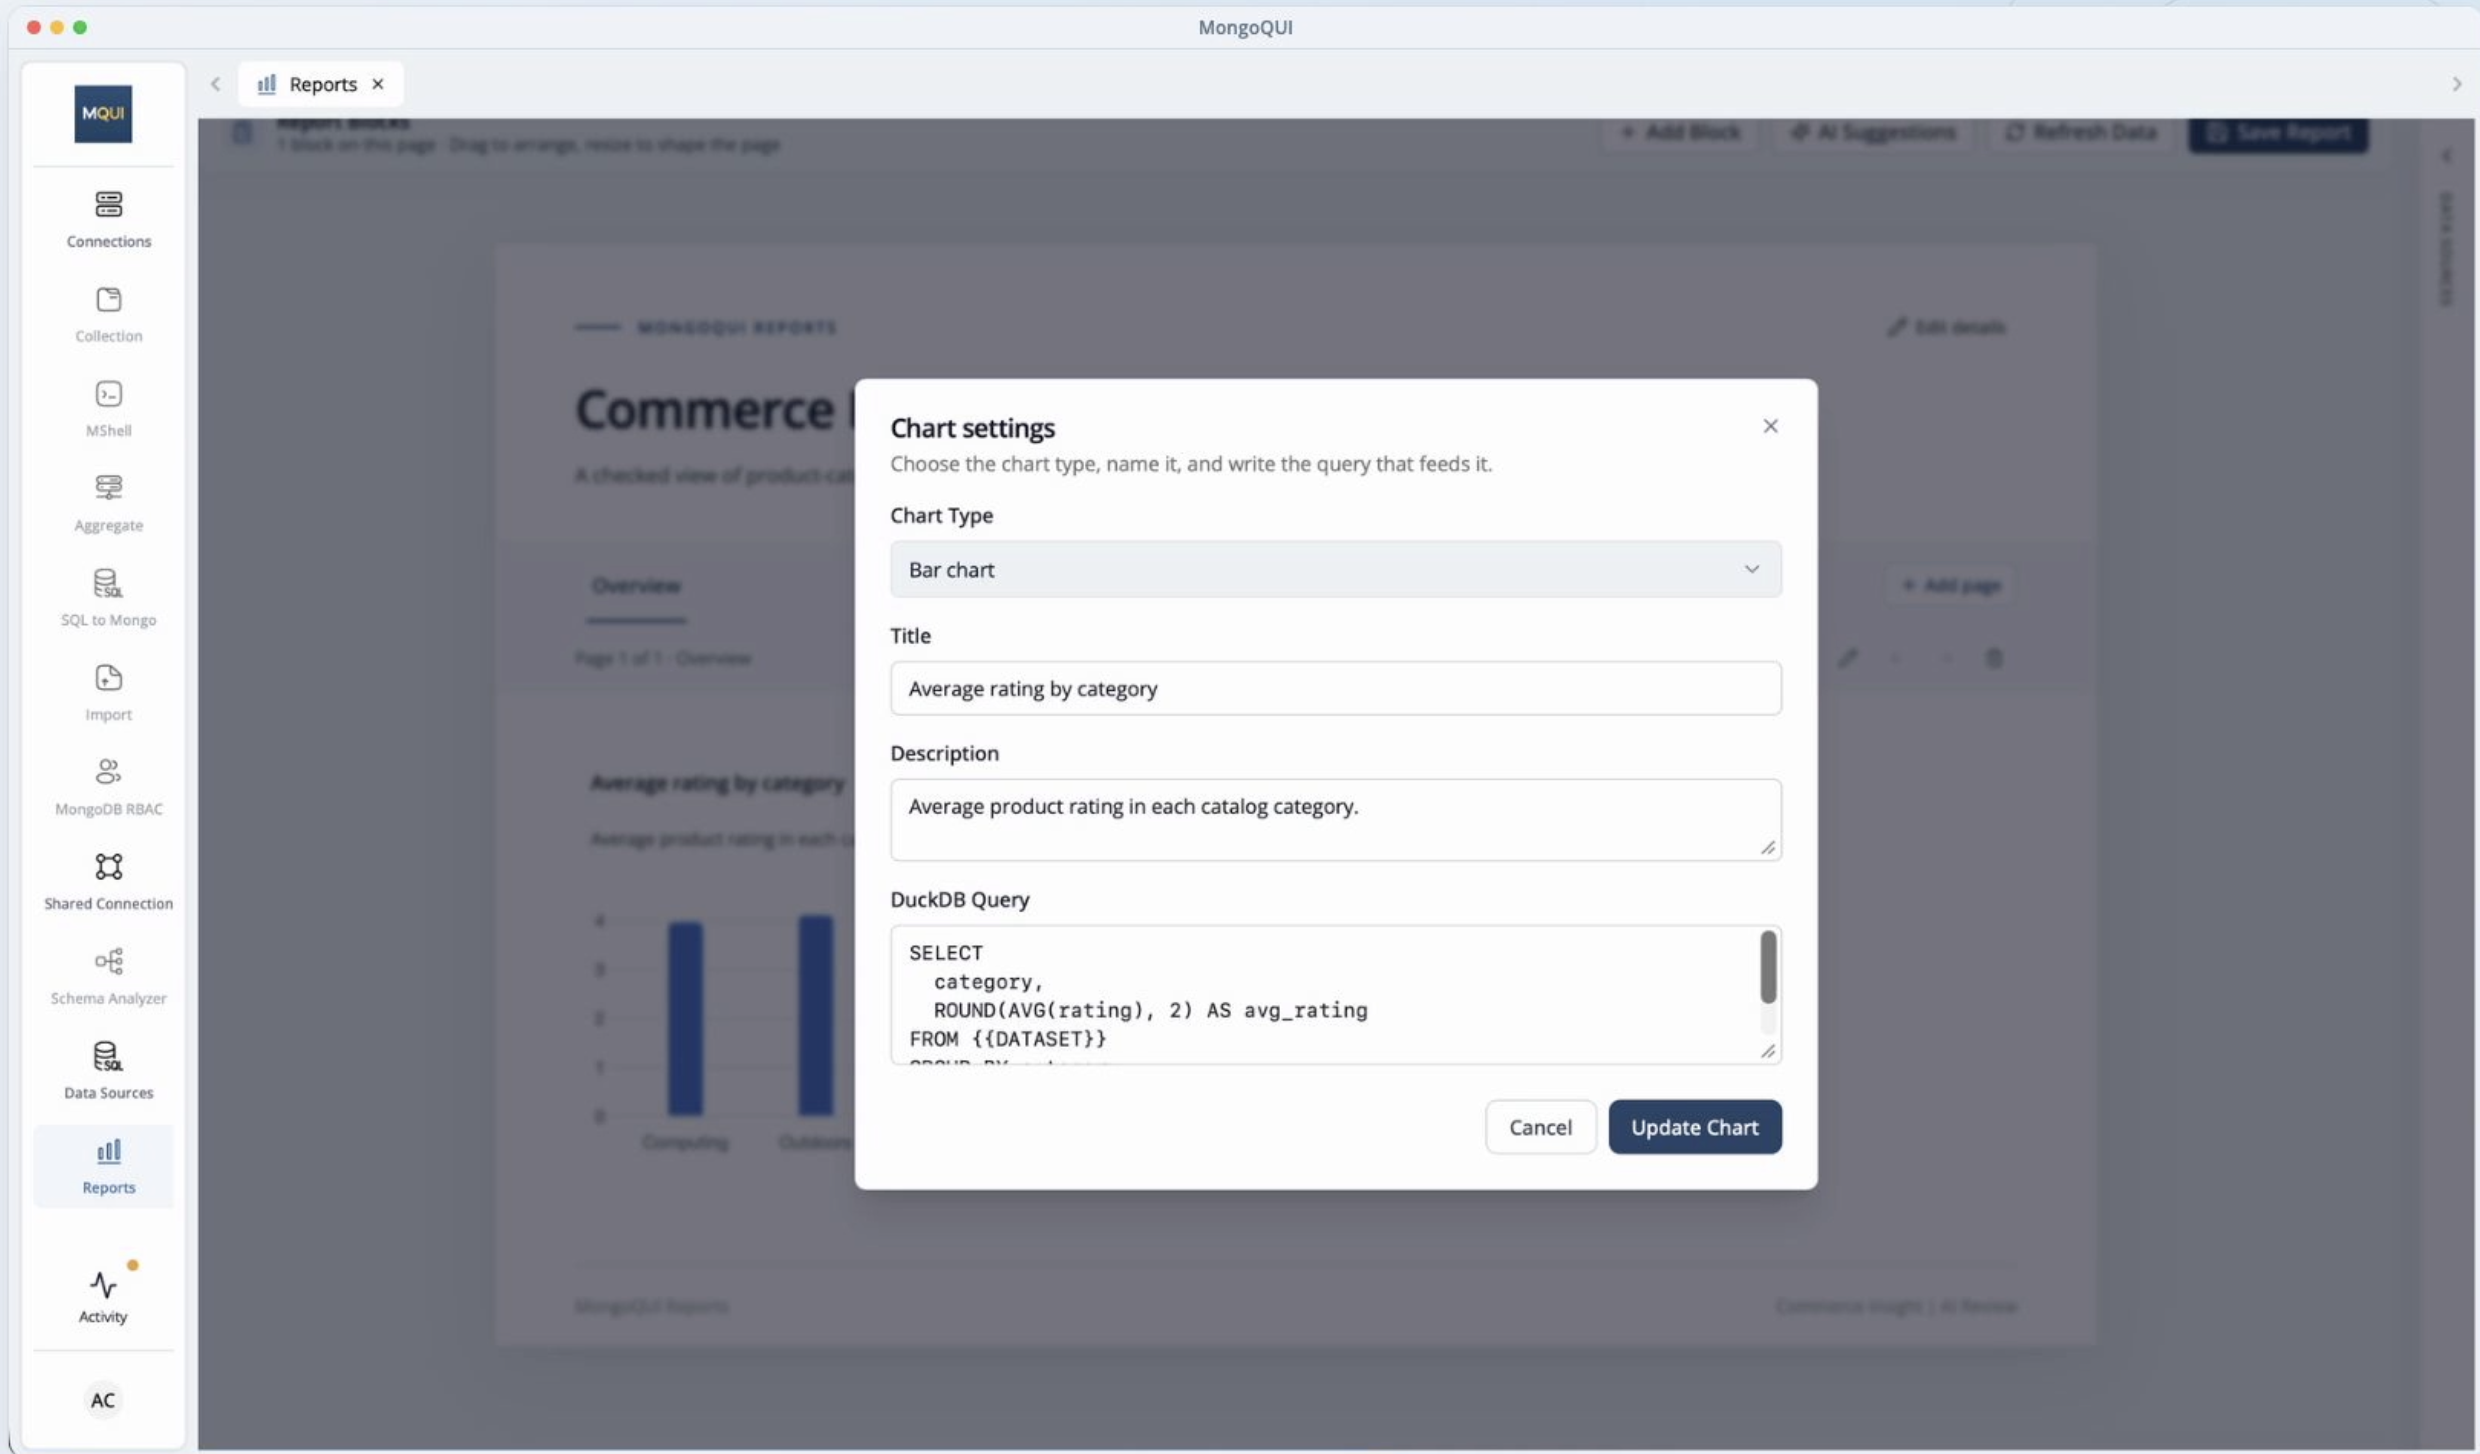
Once you’ve chosen a chart, open its settings and inspect the generated query.
For this report, the calculation should group products by category and find the average rating within each group. In everyday terms, it gathers products from the same category and calculates their average score.
This is a useful habit to build in any MongoDB query tutorial: connect the calculation to the question you’re trying to answer.
As you read the query, check three things:
The source: Does the block use the intended product catalog?
The grouping: Are products grouped by category?
The measure: Is the average calculated from the correct rating field?
The query’s dataset placeholder refers to the source selected for the block, so make sure that selection is correct before applying your changes.
You don’t need to understand every part of the query immediately. Start by checking that its main operations match the analysis you want.
Make the chart easy to read
A correct calculation is only part of a useful report. Readers should also be able to understand the result quickly.
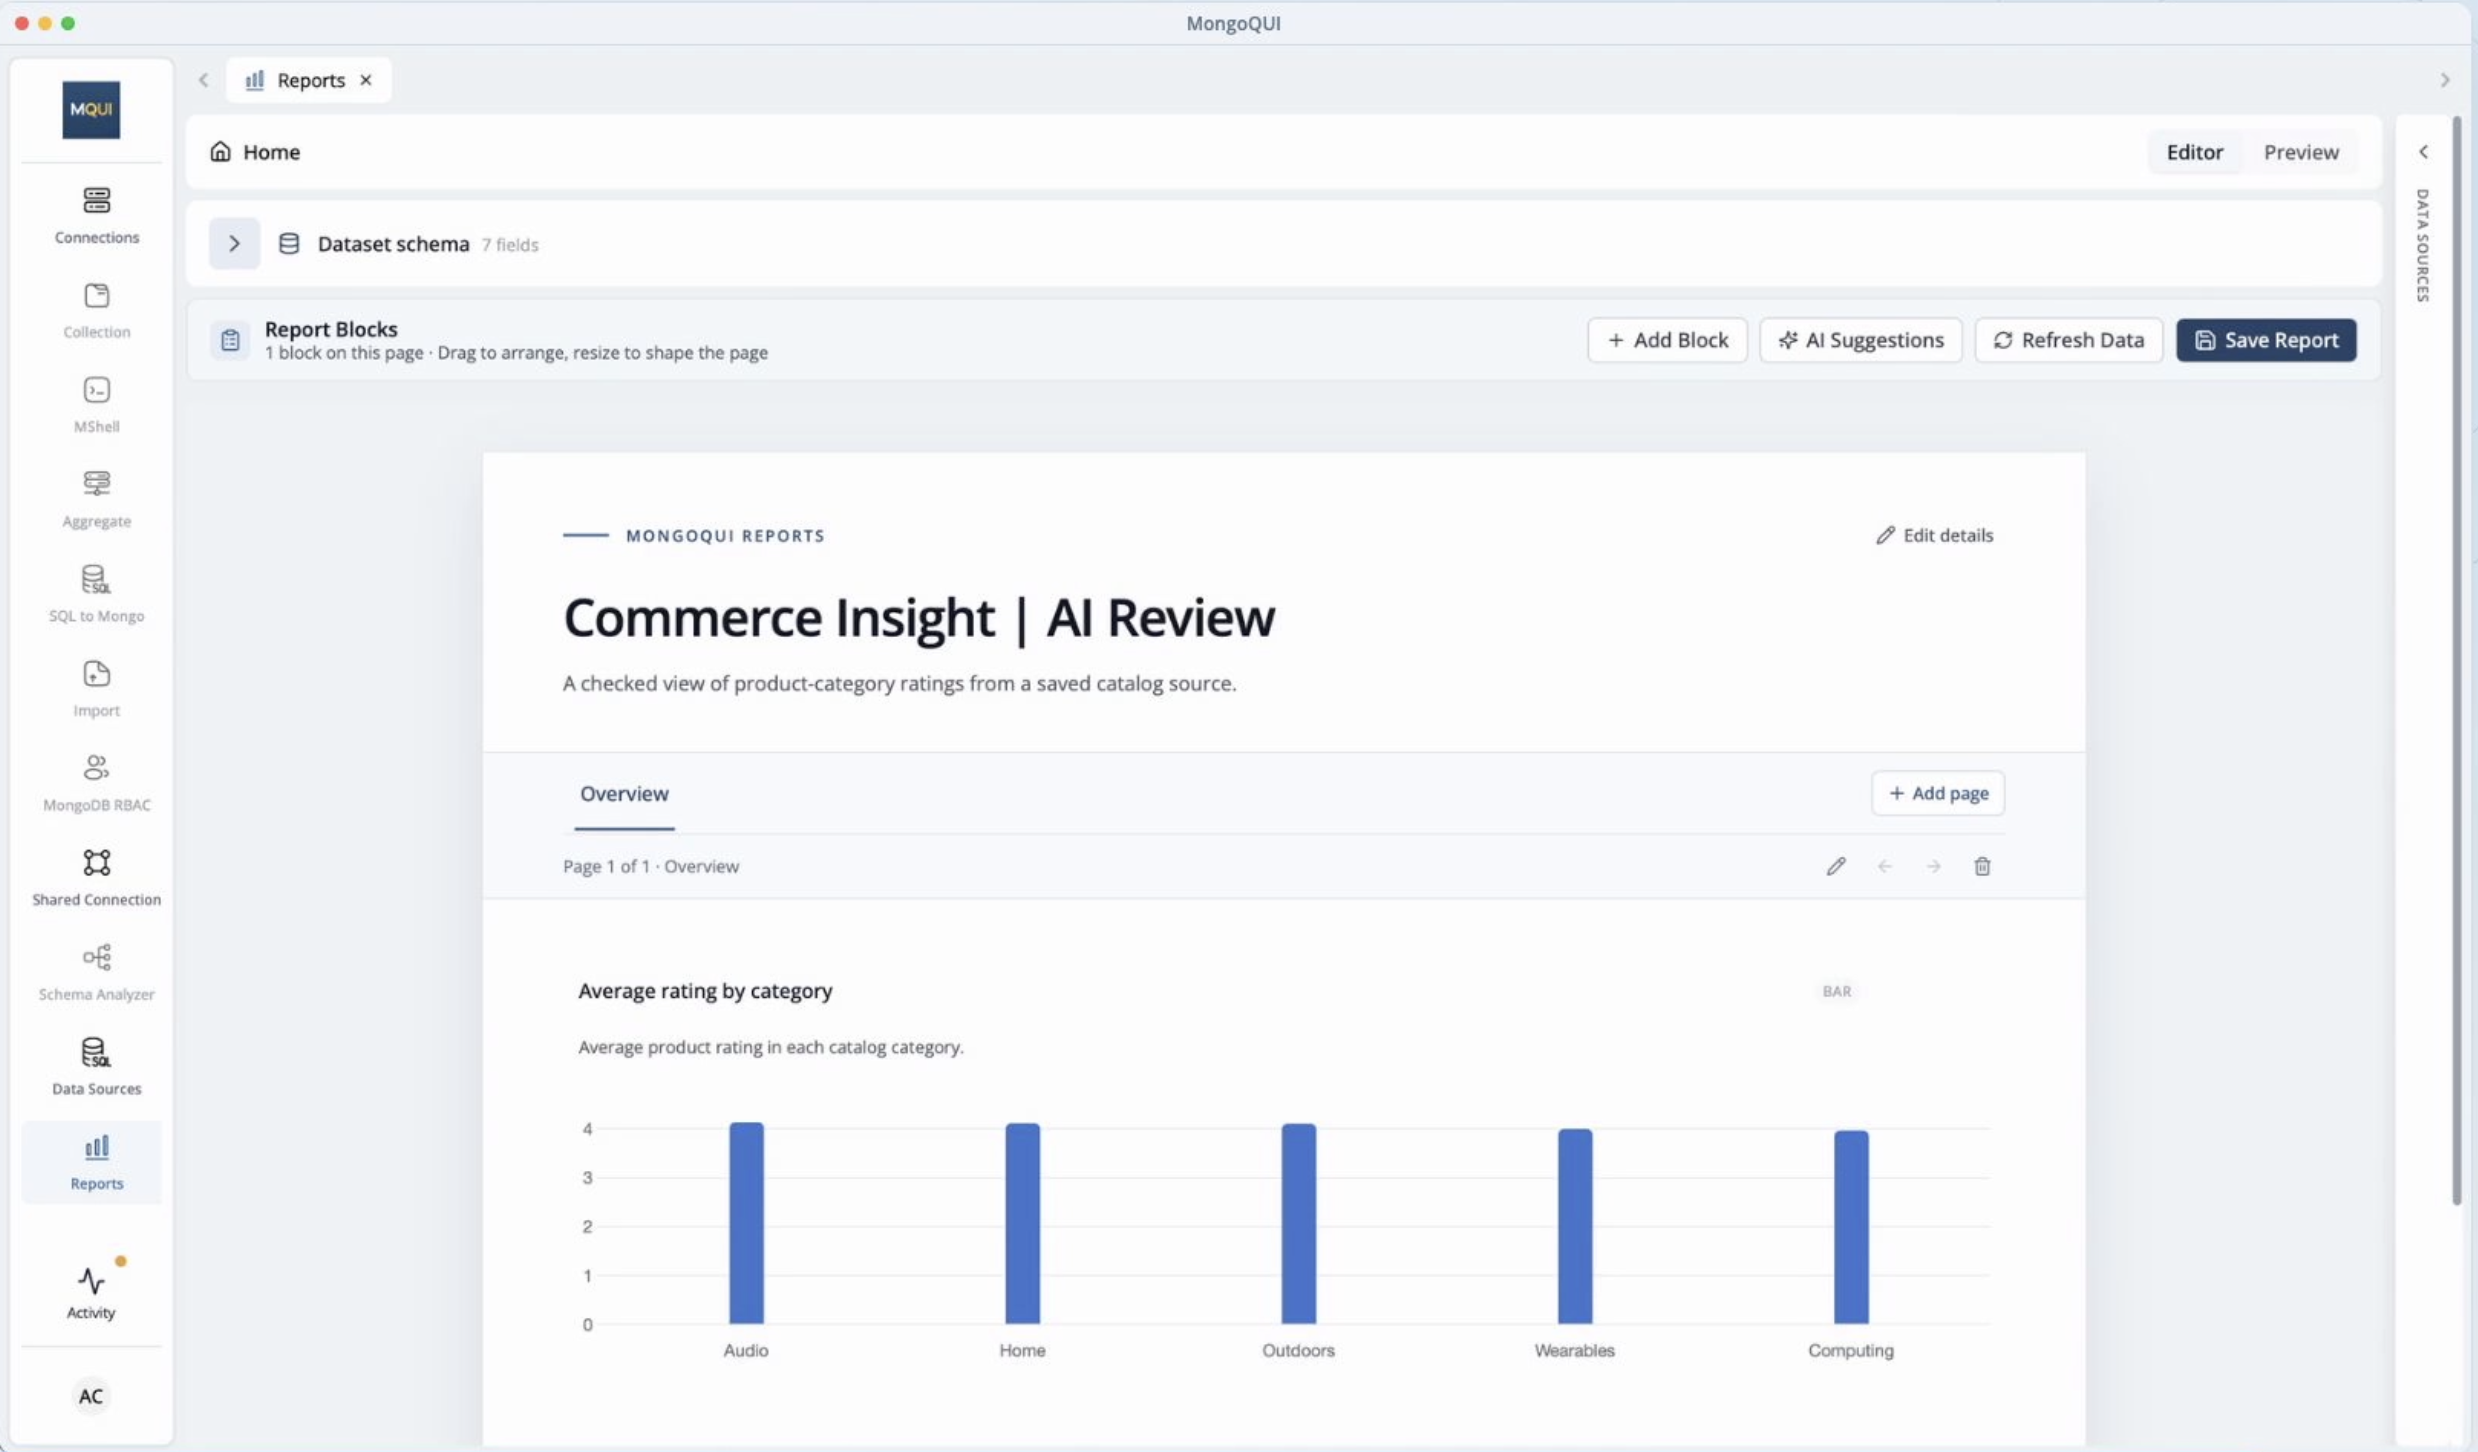
Give the chart a descriptive title, such as Average Product Rating by Category. This tells readers exactly what they’re looking at without requiring extra explanation.
Next, round the average ratings to two decimal places. A value such as 4.14 is easier to compare than a long string of decimal digits.
Keep the level of detail appropriate to the question. For a category comparison, clear labels and readable values usually matter more than displaying every decimal place.
Read through the full query once more before applying it.
Check the results against your data
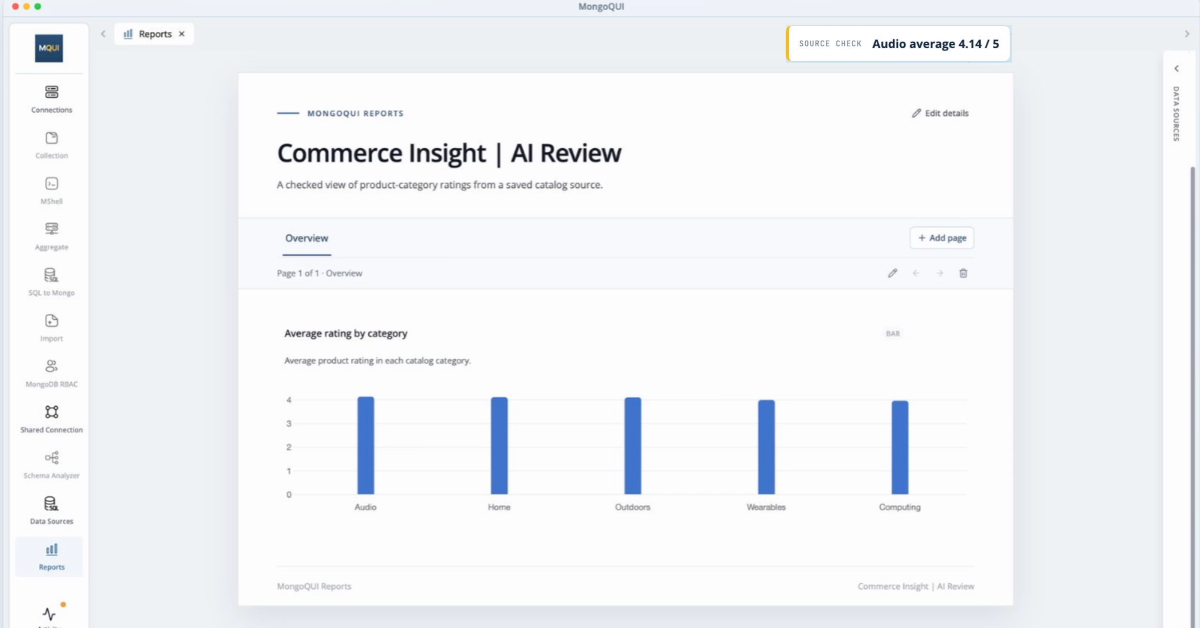
When the chart loads, take a moment to verify what it shows.
In this example, the chart contains five product categories, and Audio has an average rating of 4.14 after rounding. Checking that average independently against the source data gives the same result.
Use the same approach with your own report. Confirm that the categories are the ones you expect, then compare a displayed value with a calculation from the underlying records.
If something doesn’t match, revisit the selected source, field names, grouping, and calculation. You can also narrow your original question if the suggestions are too broad.
Remember to check completeness as well as accuracy. A chart of average ratings answers the comparison question, but product counts still need to be included if they’re part of your intended analysis.
Save and review the finished report
Once you’re satisfied with the calculation and presentation, save the report and open Preview.
Wait for the chart to finish loading, then read it as someone seeing it for the first time. Does the title explain the chart? Are all category labels visible? Are the values easy to compare?
Finally, reopen the saved report to confirm that the block and your changes have been saved.
Put your next question to work
AI Suggestions make it easier to move from a question to a first draft. Your review turns that draft into a report you can explain with confidence.
Start with one question about your data. Choose a suggestion that fits, check how it calculates the result, and make the chart clear enough for someone else to understand. In MongoQUI, that’s a practical way to build both a useful report and a better understanding of your MongoDB data.
Related posts.
Share MongoDB Query Results: From One-Off Answer to Reusable Report
“Can you send me those numbers again?” It starts with a simple request. You query MongoDB, find the records, and send a spreadsheet. A week later, someone needs the same breakdown. Now you are looking for the original filter, checking the columns, and preparing another export. When a question keeps coming back, the work behind the answer should be reusable. In MongoQUI, you can save query results as a **data source**, then use that source in one or more reports. Your operations team gets an order review. Your manager gets a regional summary. Both start with the same prepared data. Here is how to build that workflow, from the first query to a report you can share.

How to Build a Better MongoDB Report With AI Suggestions in MongoQUI
Your product team asks a simple question: which categories have the highest average rating? The data is available, but turning it into a useful report takes several decisions. You need to choose the right dataset, define the average, build the query, and present the result clearly enough for someone else to use. MongoQUI’s AI Suggestions can help you get started. They give you proposed report blocks and queries to review, so you can spend more time checking the answer and improving the report.
Introducing MongoQUI: From MongoDB Data to Answers Your Team Can Use
From exploring MongoDB documents to sharing an answer your team can use. “Which orders still need attention?” The answer is in MongoDB. Getting it into your team’s hands is where the work begins. Someone needs to inspect the records, write the query, check what the numbers mean, and turn the results into something another person can act on. A straightforward question becomes a chain of exports, spreadsheets, and follow-up messages. When someone asks for updated numbers, that chain starts again. We built MongoQUI to make that journey easier: from understanding your MongoDB data to sharing an answer your team can use again. MongoQUI is a MongoDB GUI and workspace that brings database exploration, visual query building, aggregation pipelines, and reporting together. You can investigate a question, build the logic behind the answer, and turn the results into a report within the same workspace. It is built for developers who work with MongoDB, analysts who need to understand its document
Get shipping updates once a month.
A monthly digest of what shipped, what’s coming, and one long-form post we loved. Unsubscribe in one click.
By subscribing you agree to receive monthly updates from MongoQUI. See our Privacy Policy.